Saturday 26 December 2020

AI: Colorizing Old Videos

It has been a couple of weeks since my last blog post, and that for a good reason (my second son arrived earlier this month).

I announced his arrival with some posts about some of his ancestors. One of the posts contained a video from the early 1950's.

There is a online tool (Jupyter/Python) that can colorize black/white photos and videos.

What It Does

DeOldify is based on Generative Adversarial Networks, where two Neural Networks compete to each other.  One Neural Network (generator) tries to produce realistic colorized pictures, and the other (discriminator) tries to tell whether pictures are authentic or colorized. The generator tries to fool the discriminator, and the discriminator tries to reveal the generator. When they work together, they will for example learn to create pictures that appear realistic to human beings.

DeOldify uses an extension of GAN that is called NoGAN. NoGAN eliminates some side effects of GAN for videos, for example flickering colors between frames.

You can find an interview with one of the inventors below.

How to  Use:

Step 1: I uploaded the black/white video file to YouTube. I wanted it to be available for deOldify but I didn't want it to be searchable yet, so I used the unlisted option. With the unlisted option, one needs the direct link to the video in order to see it.

Step 2: Follow the steps in deOldify Colab. One can run it in the cloud, or on a local computer, if desired. Provide the link to the video in step 1 when it is time to run the Colorize! step.

Step 3: The colorization can process a couple of frames per second, so this will take some time. Once the colorization is done, download the video file to your computer.

My original video:


My Colorized Video:

I added a small watermark in the lower left side of the video to indicate that this video has been post processed.


Saturday 5 December 2020

IOT: Setting Up a Web Camera for a Headless Raspberry PI

In my IOT project, I need to take pictures with a headless Raspberry PI. 

The camera that I use today is an  USB 8$ web camera with a picture resolution of 640x480. It is a temporary solution - the official camera module v2 supports a resolution of 3280x2464 pixels and weighs only 3g.

In this project, I followed the documentation.

After connecting it to a USB port, I installed the fswebcam package:

Using the camera from command line is easy. If the resolution flag isn't specified, the RPI will use a lower resolution: 

The resulting picture has a time stamp in the lower part.

Sometimes, I need to get the pictures to my Windows 10 computer. Since I'm familiar with the scp command, I needed to install it in Microsoft PowerShell:

So far, it is quite straight forward to use Raspberry PI. The earlier models were launched eight years ago, so many of the early bugs and features has been solved over the last years. My board, Raspberry PI 3 B+ was launched three years ago.

The next step will be to setup a web server with a Wordpress web page on the Raspberry PI. I will use that for posting pictures from the web camera. Or maybe I'll just use a Python script for posting the picture on a dedicated blog.


Saturday 28 November 2020

IOT: Bringing up Raspberry PI

For my IOT project, I'll have a Raspberry PI 3 (RPI) together with some Arduino units, where RPI will serve as a secure gateway to the Internet.

The first step is to bring up the RPI and configure it for a monitor with landscape orientation.

Step 1: Protecting the RPI

Even though some of the circuits are covered, I'm still working with open electronics, that can be damaged just by me touching it. To protect the circuits, I've build a simple box in Lego, where I can still reach the USB and HDMI ports. 

Step 2: Disconnecting the Mouse and Keyboard - Bringing up SSH

I want to use the RPI without keyboard, mouse and monitor. To still be able to control the RPI, I had to install and configure SSH using this instruction.

After a reboot, I discovered that the SSH client (Windows 10/WSL/Ubuntu) timed out when trying to connect to RPI. The SSH client in DOS (Windows 10) worked fine, but I need to understand what happened to the WSL SSH client. 

Step 3: Disconnecting the Monitor - Bringing up Virtual Desktop

It is easy to install the VNC server using apt-get.

Any client will do, I selected RealVNC Viewer.

The desktop is configured for portrait mode.

Step 4: Setting a Static IP address for the RPI

I'm following the guide from raspberrytips.com. The router's IP address is  192.168.X.Y (I won't disclose details regarding my network).

The desired IP address will be 192.168.X.Z and the MAC address is Q. Now, I know enough to set the RPI to have the same IP address. In the file /etc/dhcpcd.conf, I added the following lines:

My typo on the third row disabled internet access to the RPI.
It should be routers.

Finally, I made a reservation for my RPI in my DLink router to ensure that no other device will get the same IP number.
With these changes, the RPI will always get the same IP on this network.

Step 5: Firewall and Antivirus
I'm following the Raspberry PI guide for security.

There is a discussion in the Linux community whether antivirus or firewalls are needed for Linux. Those who say that it isn't needed mean that there are very few viruses targeting Linux. To me, it sounds like "famous last words".

For my system, I personally don't see a great threa.t - I don't save any personal data on my mini computer. I will install it anyways for curiosity. I installed clam antivirus and the iptables/ufw firewall.

I created a new user with root privileges. When trying to ssh to the RPI, I was rejected. I had to add the user to the AllowUsers tag in /etc/ssh/sshd_config file.

Another measure to increase security of the RPI would be to change the SSH port number (default port is 22). Then, an attacker would need to scan the different ports for a SSH connection. Changing port number can be done by editing /etc/ssh/sshd_config.

Conclusion:


Now, the RPI is up and running with an acceptable security. I have a grip on the basics on the Arduino and I've been able to setup a project with a LCD display, several LED's, a potentiometer and a push button. 

The next step will be to connect a 8$ web camera to the Raspberry PI and to set up a web server on that micro computer.

Saturday 21 November 2020

IOT: Traffic Lights with Arduino - Timer

In the previous blog post, I created a pair of traffic lights. I also added a push button for emergency vehicles that activated a RGB LED that blinked (blue/red).

Now, I'll add a LCD display that will show how long the cars/bicycles need to wait for green light.

The LCD Display

The display that I'll use is a monocromatic display that can show two rows with 16 characters each. It has 16 pins and I'll use 12 of them:

  1. GND - Ground/Cathode. 
  2. VCC -  Anode. Connected to the 5V DC pin on the Arduino Uno board
  3. V0 - Controls the contrast of the display. The user controls the display by turning the knob of the potentiometer that is connected to V0.
  4. RS - Register Set. This pin decides whether to write data to the data register or to the instruction register. 
    1. The contents of the data register goes to the screen. 
    2. The instruction register contains instructions about what to write in the near future.
  5. RW - Select reading or writing mode. I connect it to ground, setting the LCD in permanent writing mode.
  6. E - Enable pin. This pin informs the LCD that it will receive data.
  7. D0 - not used in this case. The LCD can receive the data using either 8 data pins (quicker) or using 4 pins (simpler design). In my case, I'll go for simplicity instead of speed.
  8. D1 - not used.
  9. D2 - not used.
  10. D3 - not used.
  11. D4 - Data pin.
  12. D5 - Data pin.
  13. D6 - Data pin.
  14. D7 - Data pin.
  15. LED+ -  Connected to anode using a 220 ohm resistor.
  16. LED- - Connected to ground.

The Physical Connections

The traffic lights to the left will turn green in 14 seconds.

I had to re-wire the existing LEDs a bit to make the LCD fit to the breadboard. I also ran out of digital pins so I have used three analog pins to power the right set and one analog pin as an input from the push button. 

The Code

I added code for estimating the remaining time until the left and red set of traffic lights turns green. It takes the time in the current state into account and sums up the remaining states until the light turns green.

In case of emergency, the times will temporarily be set to 99 s.

The code is available here.

Next steps:

I'll bring up the Raspberry PI and connect it to the Arduino board. After that,  I want to send some small messages to the LCD on the arduino board.


Saturday 14 November 2020

IOT: Traffic Lights with Arduino

My first IOT project will be a pair of traffic lights that are simulating an intersection.

Iteration 1 - Time Controlled Traffic Lights: 

I've connected six LED's to the outputs of the Arduino Uno. A simple C++ program controls it. The program toggles between the two sets of traffic lights in a sequence that is common in Europe. 

Design and the code that I wrote. I used TinkerCad for making the drawing.

The code and the latest version of the sketch is available on my TinkerCad page.

Step 2 - Emergency Button

The next step is to add an "Emergency Button". Whenever someone presses that button, both sets of traffic lights switches to red and wait until the user presses the button again. Further, the RGB led will blink during that time.   


I only use two input pins for the RGB LED, since that will blink in red or blue only.
I control the brightness of that LED with Pulse Width Modulation.

When the user pushes the button (button state changes to HIGH), the system will either enter or leave the emergency state.

I had some issues with the board leaving the emergency state. The fault was mine - I messed up the output numbers and I sent output to input ports.

The next step will be more complex - I'll add a 16x2 LCD display to the system that will print some useful information to the user.

Saturday 7 November 2020

IOT: Getting Used with Arduino

 To learn Arduino, I've bought the Arduino Starter Kit. It contains an Arduino board, together with components needed for basic projects and a book that describes the projects. 

The first steps for me is to simply follow the examples in the book. I won't discuss this in detail in the blog, unless I do interesting findings.

Setting Up the Integrated Development Environment

Instead of downloading an Integrated Development Environment for Arduino, I decided to go for the web based option. The compilation of the code is done in the cloud (AWS). A small plugin (Arduino Create) is still needed on my laptop to handle the communication to the board.

Following the Book

From an engineering point of view, this isn't that interesting - but it was an important step. I needed to get my hands dirty and learn how to read the markings on the resistors, understand the difference between the long and short leg of diodes and understand why defensive programming is a good thing.


It is easy to make the first typo.
I did it, and I spent quite a while finding that bug.
If I had compared 7 to "a", the compiler would have complained immediately.

One of my favorite projects was the Crystal Ball, where a tilt sensor is connected to the board together with a Liquid Crystal Display. When the tilt sensor is activated, a random number is sent to the display.
The black box on the right side is the tilt sensor -
a little metallic ball that closes a pair of
connectors when the box tilts.
My Own Project 
Following a book isn't sufficient - I need to do something on my own. The next step is to create a pair of traffic lights with some extra functionality. I'll explore that in the next blog post.

Saturday 31 October 2020

IOT: A New Project

For the coming year, I will focus on IOT - Internet of Things. I have bought a starter kit for Arduino (a microcontroller with some basic electronic stuff like a motor, diodes, buttons, potentiometers and a LCD display). Together with a Raspberry PI computer that I got as a birthday gift, I have something to start exploring. 
My first project on my own - a simple traffic light.

I'll start with learning the basics - I follow the examples in "Arduino Projects Book" and I'll bring up a Raspberry PI to have basic security and connectivity (no mouse, keyboard or monitor connected).

The long term vision is a remotely controlled vehicle that has a web server and that can take pictures and stream video. Maybe I'll also add some sensors to log temperature. 

The initial project plan looks like this;
Green means done and yellow means "work in progress".
Green means done,
Yellow means "work in progress".
Blue means "not started".

The main obstacle from a fully mobile mini-vehicle is to charge the battery without connecting it manually. I'll look into that later on.

Saturday 24 October 2020

StockPredictor: Using Neural Networks to Try to Predict Stock Values

With the verified training data, I've been trying to predict stock performances, given some key numbers. 

I'm using the scikit toolbox for Python and the initial findings is that the neural network hasn't been able to predict the stock performances. The correlation between the predicted values and the target values is close to zero. 

Findings
I've run several iterations with different parameters, like alpha (learning rate), random state, batch size and whether to use historic data or not. They all point to the same conclusion - there is no easy-to-catch pattern that the neural network can find. 

These finding support the efficient market theory - the past information is already priced into the current stock prices. 

The distribution of the result data is hard to model using a neural network. Most of the data is small, but there are some few outliers that generates large losses for the training function.

The result distribution. 95% of the results are in the range -0.0143 up to 0.0166,
but some outliers are much bigger.


For reference, I trained a neural network for a dataset that is available in sklearn (load_diabetes). That network found a quite strong correlation between predictions and the results (75%). This means that I know how to set up and use data sets for machine learning. 

Summary of the project and the future
I have no plans to continue the project at this moment. The web scraper will keep recording stock records and I'll update the documentation.

Lessons learned:
  • Verify the data early in the project!
  • Use standard schemes for saving the data. Preferably CSV format, and/or a format that can easibly be imported into a database.
  • Add checks for inconsistent data that notifies the operator.
Unplanned future work:
  • Map the results into an machine-learning friendlier distribution. Maybe logarithmic scale?
  • Iterate over different prediction windows. Currently only 7 days is used.
  • Use other algorithms, like K-nearest neighbor.
For the end of the year, I'll explore Internet of Things (IOT) with Arduino and Raspberry PI. The train project will continue in 2021.

Saturday 10 October 2020

StockPredictor: Exploring the MLPRegressor

I want to predict stock prices using existing data. Optionally, I'll convert the problem into a classification problem ("to buy or not to buy). With the training data in place, I'll explore the Python package scikit-learn.

This article discusses some machine learning algorithms that can be used to predict a numerical value. Neural networks and K-nearest neighbors seems promising. I suspect non-linear relations between features and results, so I don't expect linear regression to work. However, I'll give it a try later.

Multilayer Perceptron Regressor

I based my program on the examples above, with my data from StockReader. 
After training the neural network on ~210 000 examples, I test it on ~50 000 examples. I compare how the neural network is doing with an dart throwing monkey (a simple prediction that the stock performances will be the average daily price increase of the stocks).

The initial output from training the neural network together with verifying it on the test data shows no improvement compared to the monkey. The Median Average Error for the Neural network was 0.095, compared to the benchmark of 0.064. 

The next step will be to investigate other parameters for the neural network, along with other algoritms. Since I will compare different models, I will need to introduce cross validation data. This is important, since I need to make sure to verify the model selection itself.


Useful link:

Saturday 26 September 2020

StockPredictor: Adding Past Values to Training Data

In my training data for the predictions, I use the following data to predict the changes in stock prices:

Stock Price, P/E, P/C, Yield, Price Margin, RSI and the number of days to dividend. 

I want to be able to add historic key numbers as well and I'll specify that using bit masks,

PriceP/EP/CYieldRSIPMRSI
Days to Dividend
Todayxxxxxxxx
One week agoxxx
Two weeks agoxxx
Three weeks agoxxxx
Code (binary)
11110101100111011011000100010011
Code (Hex)F59DB113

For simplicity, if one parameter is required two weeks ago, the script that generates the training data will add all parameters two weeks ago. The selection of parameters will happen in the prediction script. 

There won't be matching historic dates for all stock records in the database. For the historic dates, I'll try the calculated date +/- one day.
If the current stock record date is on the 27th, I'll search for the one-week-old record on the 20th. If that date can't be found, I'll search for the 19th and 21th. If neither can be found, the program will give up fetching records for that date.

This means that the training set will be some 50% smaller. Removing half of the training set in order to train the neural network on what happened to stocks over the last weeks can, in theory, bias the underlying data. Assumption: I assume that the performance of the recorded stocks are independent on when I recorded the training data.

In the network trainer, the data that isn't used will be removed from the training set. The script will drop the columns that I don't need according to the bitmask.

The next step is to evaluate some machine learning algorithms on the data.

Saturday 12 September 2020

StockPredictor: Selecting Algorithm and Some Design Considerations

This is the third part of the stock project, where I will use the validated data to train a machine learning system to predict the performance of a stock based on the data that was available at the date of the stock record.

The first step is to make some design considerations for the algorithm. The earliest program will only look at the current stock record for features (X) and the results (y) will be the daily change of the stock.

If I select the prediction window to one week, one example of features and results would be:


The results from a query in the database will look like this:

The X data can consist of values of P, P/E, P/C, Yield, PMI, RSI and the time to/since the last dividend. The y data for the stock record of 2018-10-31 will be the change (%) divided by the days: 
The daily increase of ABB's stock price was 0,054% during one week in November, 2018.
It would have been more mathematically correct to take the seventh
root of the quota, but this time I'll prefer simplicity.

For training data to be useful, there must be a price record in the future that can be used ad y.

I'm saving the data to a huge panda dataframe (the process of populating it from the database (with some necessary processing) takes ~35 minutes. To avoid repeating this cumbersome process every time, I save the dataframe to a csv file, that can be used directly to train the machine learning algorithm. Loading that file takes less than a second.

The Data Set
I suspect that some of the data are highly correlated to each other. For example, Price, P/E and P/C are correlated in the short-term, since earnings and capital per share seldom changes. 

Sometimes, the data contains zeros or null values. 

Regression or Neural Networks

Both regression and neural networks has some pros for this dataset. 

Linear regression

A linear regression would be intuitive for predicting the change in stock price. But there are some zeros in the underlying data that I fear will skew the results. It also seems to be tricky to handle XOR relationships between features. 

Multi-Layer Neural Networks can model complex relationships such as XOR relations and zeroed records. I'll start with this one initially. The

SciKit-Learn

Sklearn has a neural-network-ish regressor that I will investigate.


Saturday 29 August 2020

StockAnalyzer: Identifying Stock Splits

I've spent the last weeks on handling missing data and other inconsistencies from the raw data files that I've got from the web scraping over the years. Data that I am confident that I can restore is restored (for example earnings per share, a number that changes only every third month). For the other data, I delete it if I can't recover it.

Being able to use some Linux commands (sed, grep) on my Windows environment has saved me hours of manual work,

I am now able to get more than 250 000 stock records into the database, so I have enough to start running some simple scripts for analyzing the data.

The features X are the existing data, such as key numbers and time to next report. The results y will be the daily increase in the stock price over one week.

Identify Splits:
The first task is be to identify stock splits. If I don't take splits into account, the y values will be skewed and mess up my machine learning (If the stock price falls because of a split, I may train the system for a price drop that never happened).

I'll compare two cases for a stock to illustrate the difference between a split and an actual price drop for a stock:

Both Stock A and Stock B are originally valued to $100 per stock. The earnings per stock is $10 and the capital per stock is $40. Thus, the P/E is 10 and the P/C is 2,5.

After a stock split, the new stocks A' are valued to $50 per stock. The earnings per stock is now only $5,  and the capital per stock is $20. The P/E is still 10 and the P/C is still 2,5.

The stock B has a price drop to $50. The earnings per stock is still $10 and the capital per stock is $40. The P/E is now 5 and the P/C is now 1,25.
The Troax stock had a 3:1 split (one stock became three) on 2019-06-18.


After a stock split, I expect the P/E and P/C to be roughly the same. So if there is a significant change in stock price without corresponding changes in the P/E and P/C values, but with changes in the E and C values, I have likely found a split.

The Code:
The script starts with iterating over all unique stock names in the database. 

For each stock, I query all stock records and I check whether the price has changed more than a predefined threshold. 

If it has changed, I check whether the capital and earnings per share has changed. If it has, I'll record the date and stock name to a list for later use (it's hard to estmate the split ratio, so I don't save that for now). The splits are saved to a comma-separated file. 
Sometimes, it can be hard to make an accurate estimate of the split ratio. 

To verify that the splits are OK, I queried Skatteverket (The Swedish Tax Authorities) manually for several splits. As expected, the reported splits were correct.

Now, the pre-processing of the data is done. It took much more time than I assumed and that is mainly because that I didn't check the data when scraping. 

Saturday 25 July 2020

StockReader: Handling Broken Scaping

I've seen that the web scraper StockReader script sometimes halts due to various reasons. For example. it can be timeouts from the server.
The connection error is seen occasionally.

I'll handle this by running the script again and again until I get the data I need, while skipping the records that I've already collected.

The first step is to make StockReader check for existing files:

The second step is to acquire the stock names along with the stock ID's for the source web page. Using the names, I can tell whether the particular stock has a record or not. I did that using regular expressions in the script.


The third step is to open the file in read mode (if it exists), and store the contents of that file. After that, I'll close the file.

The fourth step is to open the file in append mode and iterate over all stock names, and fetch the stock data for the missing stock records.

The program works best if I run it some five times. Then it is likely that I'll catch most, if not all stock records for that day.

Issue:
For long stock names, the name is truncated in the web page that lists all stocks:
From the list of active stocks: A3 Allmänna IT- och..
From the in stock info web page: A3 Allmänna IT- och Telekomaktiebolaget
I resolved that issue by adding a second list of truncated stock names. If a stock was found in the truncated stock name list, I iterated over all stock names that already has a stock record. If one of those matched the stock name, the program didn't query that stock information.

Saturday 11 July 2020

StockAnalyzer: Chasing errors

The work on Stock Analyzer will focus on two tracks in parallel:

  1. Fixing existing data to fit into the database (Scope of this blog post)
  2. Visual the data that is in the database
I see errors when the program is trying to parse values to the database. For example:


2017-06-05 - 2017-08-14: Unable to parse '2017-08-15'. 
2017-08-19 - 2017-11-01: Unable to parse '2017-11-07'
2017-11-06 and later: Unable to parse '2018-02-22'

The issue is that the program tries to parse a date into an integer since the date is on the wrong position in the file.

The first step is to check which stocks it could be that has the faulty data. I can easily do that using grep in my WSL2 environment on my Windows 10  computer.

The faulty data for June contains the string "2017-08-15".
This string is found in the following stocks:
Eniro, Concordia Maritime, Clavister Holding, MindMancer and Tethys Oil 
When importing the different stock records to a spread sheet to see which of the stocks are faulty.

Tethys Oil seems to have some missing data.
I did some maths on the remaining data to check if it is possible to recover the missing bits, but it wasn't. I'll simply remove the records for Tethys Oil for the missing period of time. A new grep instance gives:

This means that the stock records for the company Tethys Oil are corrupted between May 9th, 2017 and November  9th, 2017. Now, I want to remove those lines for the files ranging from 20170509.csv up to 20171109.csv.

For a given file, it is easy to remove lines containing "Tethys Oil":
sed '/Tethys Oil/d' -i file.txt
To identify the files in the desired age span, I tried to find a way to do lexicographic comparisons of the file names in the bash shell. It turned out not to be trivial, so created a Python script instead. 

The output are commands that removes all lines containing Tethys oil from the files in the interval. After pasting them to bash, the erroneous lines has been removed from the files.


Saturday 27 June 2020

Linux: Windows Embracing Ubuntu

In the past, Microsoft has had an reluctant view on its competitors, such as the Linux and open source communities. Linux has put in huge effort to make it Windows-compatible, but those efforts hasn't been mutual.

Over the last years, Microsoft has changed its approach to the open source community. I assume that it is a pragmatic decision - Windows is still dominating the desktops, but nowadays there are many more areas where Windows hasn't been able to compete with Linux, such as servers, smart phones and embedded systems.

Windows Subsystem for Linux
A couple of years ago, Microsoft introduced Windows Subsystem for Linux. It is a compatibility layer that makes it possible to run a Linux distribution inside a virtual machine in Windows (WSL 2). Currently, it is configured for command-line applications only, but there are web sites describing how to setup an X- server for WSL 2.

As it is possible to reach all files in Windows from the Linux VM, and also to reach the home folder from Windows, it is easy to modify files and scripts.

Installation
Microsoft has an excellent installation guide for WSL.
  1. Ensure that you are using a new version of Windows 10. You want to have Windows build 18917 or higher to run WSL 2.
  2. Enable Viritualization on the computer. In my case, those settings were already enabled. 
  3. Enable Windows Subsystem for Windows. In Power Shell, run:  Enable-WindowsOptionalFeature -Online -FeatureName Microsoft-Windows-Subsystem-Linux
  4. Install WSL 2 from PowerShell
  5. Install a Linux Distribtion of choice from Microsoft Store
  6. Wait for Microsoft to develop GUI support on WSL 2
In Linux, Windows drives can be found at /mnt/ . In Windows, the root of the Linux file system can be found at \\wsl$\<distribution name>. In my case. the distribution name is ubuntu.  More info here.

Roadmap for WSL
Microsoft has announced that they intend to add support for GUI apps on WSL 2. That will be very useful.

Embrace. Extend and Extinguish?
There is a discussion about whether WSL is a way for Microsoft to embrace Linux in order to take over it. Even I have had concerns and some hostility towards Microsoft in the past, but in this case, I am not to concerned. My understanding is that Microsoft has had a change-of-hearts towards Linux.

Adding WSL/Linux is a way for Microsoft to stay relevant and prevent developers from leaving Windows entirely.


After all, WSL 2 introduced a full Linux kernel (WSL was a translation layer). This is a step towards more Linux.

Linux is still dominant when it comes to servers, embedded systems and Android. Microsoft had an attempt to enter the smartphone market but gave up its development in 2017.

UNIX/Linux has a strong position as a development environment, and as Linux distributions are getting more user friendly, and as applications are moving to web servers, Microsoft may face a challenge to keep people and developers to stay on their platform. Allowing the user to have both may be one way to keep the users. Simplifying Linux on Windows is an important step for Microsoft to stay relevant for developers.

Time will tell what influence Microsoft will have over the Linux ecosystem.

Saturday 13 June 2020

StockAnalyzer: Resuming Transmission

After focusing on global pandemics and relocations for the last months, I am able to resume focusing on my pet projects, but at a slower pace than before. I expect to post at least once per month.

I'll continue coding for the machine learning project StockAnalyzer.

Earlier this year, I explored NodeJS. I'll switch to Python instead, since it is more flexible and since I'm more familiar with it.

StockAnalyzer
I'll document the project in a separate page on the blog. The source code is available on my GitHub page.

StockAnalyzer will both present a number of graphs of how some key numbers are evolving over time.

StockAnalyzer will also perform an automated scan of all key numbers for all records over time in order to detect flawed data, where the data formats are OK, but the numeric values appear to be invalid. This will be done later.

Here, some key numbers are shown over time.
The graphs will help me find outliers and understand the data.
The first step is to present the data graphically - the vast amount of data will make it impossible to just look at the numbers.

Several of the curves appear to have identical shapes. The curves that relates the price to the earnings and capital will be similar to the price curve. This because the earnings and capital per share doesn't change very often. The yield is the dividend divided by the price and that is inversely correlated to the stock price.

In the next blog posts, I'll keep exploring the data.

In the following blog posts, I'll explore the data

Saturday 21 March 2020

Discontinous Transmission

I will temporarily reduce the frequency of posts on this blog. The reasons are both on macro and micro scale.

We're in the middle of a move to a house in Ã…karp. This project takes quite some time. Once we have moved, we need to learn about the house, explore the surroundings and get involved in the local community.

On a larger scale, escalating numbers of Covid-19 cases will have some impact for me:

  • The Disease - Probably low risk for me and my family, since we are not in the vulnerable demographic groups. But we have relatives that are.
  • Disruptions -  Several countries has introduced travel bans and quarantines for large populations. 
  • My work place has encouraged me and my colleagues to work from home. Schools and kindergartens are still open but this may is likely to change. 
  • Increased demand for some supplies has temporarily emptied shelves.
  • Financial Markets - the stock market and oil price has collapsed. 


I need to focus on all this for a (hopefully) short period of time. I'll post again when we've moved and things has calmed down a little.

Saturday 7 March 2020

StockAnalyzer: Enabling SQL Server Locally and Accessing it From Python

I've had some challenges when attempting to connect a NodeJS app to a MS SQL database on my computer. To trouble-shoot, I'll start with connecting a python script instead to a database.


  1. First, I need to make sure that the SQL server  is up and running.
  2. After that, I'll test the connection using Python or an UDL file.
  3. If that works, I'll connect using NodeJS
Step 1: SQL Server
From the app Sql Server Configuration Manager, SQL Server is running on my machine.
SQL Server Browser isn't active however. That app provides information about SQL resources and SQL server instances on this computer. It listens to UDP port 1434 and allows several different SQL Server instances on the same port.

If TCP/IP is enabled for  a SQL server, that server is assigned to a port. In addition, it is possible to make the server listen to a specific pipe. 

SQL Server reads out all active instances of the computer and notes their corresponding ports and pipes.

It is possible to reach SQL servers without the SQL Server Browser running on the host, but then the port (and pipe) needs to be specified. It may be necessary to open up a couple of ports in the firewall, such as 1433 and 1434.

First Attempt to Connect to SQL Server Using Python:

The script can't find the SQL server.
Second Attempt to Connect to SQL Server Using Python:

Now, the script can find the SQL server but it can't find the data source.
Now, the script seems to have come a bit further. It doesn't complain about not finding SQL Server anymore. Instead, it says that it can't find the data source. The reason is most likely because I've specified the wrong version of ODBC Driver. 

Third Attempt to Connect to SQL Server Using Python: 
This time I'll specify the actual version of SQL driver: 17.

Yay!

Now, I know that the SQL Server is up and running on my local computer, and I know how to access it from Python. The next step is to connect using a NodeJS script. I'll explore that in the next blog post.

Saturday 22 February 2020

StockAnalyser NodeJS: Connecting to an Existing MSSQL database (1)

Important:
This blog shows my learning curve in different programming languages. Take my code with a large grain of salt.

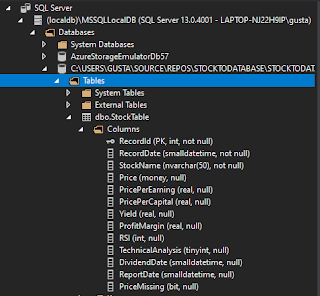
The NodeJS script shall connect to an existing MS SQL database. This blog post summarizes some of the initial investigations to make this happen.

The connection string is:

The different components of the connection string are:
  • Integrated Security means that I am not using a username/password.
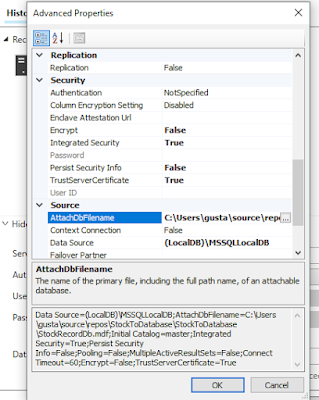
  • AttachDbFileName points to the file on the file system
  • Data Source refers to the MS SQL Server instance.
First step is to find and control the SQL Server software. Sometimes, it comes with the installation of Microsoft Visual studio. The software SQL Server Data Tools isn't included in my MSVC installation  (2017) and I need to add it using the MSVC installer.

The settings for my local database


Normally, the SQL Server Data Tools provides the server to other applications. For some reason I don't have it so I will install MS SQL Server on top of MSVC in the next blog post.