Showing posts with label Economics. Show all posts

Saturday, 12 September 2020

StockPredictor: Selecting Algorithm and Some Design Considerations

This is the third part of the stock project, where I will use the validated data to train a machine learning system to predict the performance of a stock based on the data that was available at the date of the stock record.

The first step is to make some design considerations for the algorithm. The earliest program will only look at the current stock record for features (X) and the results (y) will be the daily change of the stock.

If I select the prediction window to one week, one example of features and results would be:


The results from a query in the database will look like this:

The X data can consist of values of P, P/E, P/C, Yield, PMI, RSI and the time to/since the last dividend. The y data for the stock record of 2018-10-31 will be the change (%) divided by the days: 
The daily increase of ABB's stock price was 0,054% during one week in November, 2018.
It would have been more mathematically correct to take the seventh
root of the quota, but this time I'll prefer simplicity.

For training data to be useful, there must be a price record in the future that can be used ad y.

I'm saving the data to a huge panda dataframe (the process of populating it from the database (with some necessary processing) takes ~35 minutes. To avoid repeating this cumbersome process every time, I save the dataframe to a csv file, that can be used directly to train the machine learning algorithm. Loading that file takes less than a second.

The Data Set
I suspect that some of the data are highly correlated to each other. For example, Price, P/E and P/C are correlated in the short-term, since earnings and capital per share seldom changes. 

Sometimes, the data contains zeros or null values. 

Regression or Neural Networks

Both regression and neural networks has some pros for this dataset. 

Linear regression

A linear regression would be intuitive for predicting the change in stock price. But there are some zeros in the underlying data that I fear will skew the results. It also seems to be tricky to handle XOR relationships between features. 

Multi-Layer Neural Networks can model complex relationships such as XOR relations and zeroed records. I'll start with this one initially. The

SciKit-Learn

Sklearn has a neural-network-ish regressor that I will investigate.


Saturday, 13 June 2020

StockAnalyzer: Resuming Transmission

After focusing on global pandemics and relocations for the last months, I am able to resume focusing on my pet projects, but at a slower pace than before. I expect to post at least once per month.

I'll continue coding for the machine learning project StockAnalyzer.

Earlier this year, I explored NodeJS. I'll switch to Python instead, since it is more flexible and since I'm more familiar with it.

StockAnalyzer
I'll document the project in a separate page on the blog. The source code is available on my GitHub page.

StockAnalyzer will both present a number of graphs of how some key numbers are evolving over time.

StockAnalyzer will also perform an automated scan of all key numbers for all records over time in order to detect flawed data, where the data formats are OK, but the numeric values appear to be invalid. This will be done later.

Here, some key numbers are shown over time.
The graphs will help me find outliers and understand the data.
The first step is to present the data graphically - the vast amount of data will make it impossible to just look at the numbers.

Several of the curves appear to have identical shapes. The curves that relates the price to the earnings and capital will be similar to the price curve. This because the earnings and capital per share doesn't change very often. The yield is the dividend divided by the price and that is inversely correlated to the stock price.

In the next blog posts, I'll keep exploring the data.

In the following blog posts, I'll explore the data

Saturday, 29 June 2019

StockAnalyzer: Validating the Raw Data - Missing Price

In my last blog post, I was able to add data from July 2013 and later. Before that, the data has a different format and I will handle that soon.

I have seen that I will need to check the data before adding it to the database. Sometimes, data is missing and sometimes, the data comes in a different shape.

I will discuss the issues when I see them.

Missing Price Information:
The web site that I use displays the price (the price of the last transaction) if there has been any transactions that day. If no transactions has happened that day, the price field is empty.

If that number is missing, the parameter "P" will have the value null. However, it is always possible to calculate the price by multiplying P/E by earnings per share (E). I'll illustrate with a real-world example:

On October 9th, 2014, the trade in the Swedish company Eniro was halted by the stock exchange in Stockholm and the Swedish Financial inspection. For that day, all trade was halted for Eniro and there was no price quote for that day.

The stock price number is corresponding to Senast (Latest). Screen dump from June 2019. 
The screen shot above shows the web pages that I'm scraping. Most of the times, the fields are populated with data, but there are some exceptions. In the case of Eniro, the dividend (utdelning) and yield (direktavkastning) are omitted since there is no yield for that company. The webscraper interprets those fields to be zero.

Price is available for Eniro (10,19 SEK per share). The price corresponds to the the P/E (1,84) and Earnings per share (5,52) since 1,84 times 5.52 equals 10,16 SEK.  
On October 9th, 2014, price info was omitted. It is still possible to estimate the price using:

  • Price/Earnings rating, the Earnings per share and also 
  • Capital per share and the Price per capital:

On October 9th, 2014, no trades were done for Eniro.
As a consequence of that, there is no record of stock price for that date.
Multiplying P/E by E gives 6,77 SEK. 

 I expect this to happen very seldom, but I will add a row to the database that indicates when the price information is missing. The neural network will tell whether a missing price information will predict anything in the future.

Coding:
After fetching the stock record, all data are represented O as a string list. In this case, the string for price is empty, and string2Float thus returns null.


I added a function inside the method for scanning the stock record. That function is in the same scope as the other variables and can modify them.
 If P is null, P is recovered using P/E and E and a boolean parameter is set to indicate that the parameter was missing from the raw data.
 I have updated the database to include a bit telling whether the price information was missing in the stock record.
Now, the price is added along with an indicator of missing price. "1" indicates that the price is missing.

Saturday, 22 June 2019

StockAnalyzer: Scanning the Stock Files for Data

Now, I will start to interpret the data in the input files (YYYYDDMM.csv) and generate SQL commands based on that information.

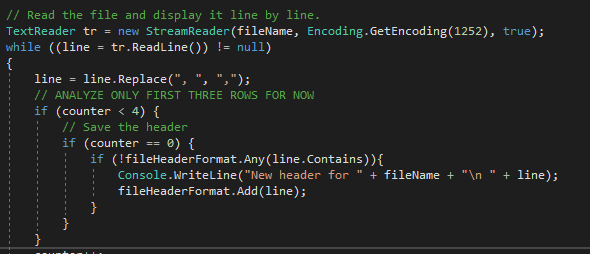
I will start by analyzing the headers of all the data files.

I collect all unique headers to a stringlist and print the contents to the console.

There is plenty of data but I will only use some of it. The data that is common for all three different kinds of versions are:
  • Name,
  • Price (P),
  • Earning per share (E),
  • P/E - This is redundant and can be calculated from P and E. I'll use this to verify  P, E and P/E values
  • Annual Dividend (D)
  • Stock Yield (D/P) - This is redundant and can be used to verify P, D and D/P
  • Capital per Share (C)
  • Price/Capital (P/C) - This is redundant and can be used to verify P, C and P/C
  • RSI - Indicator of volatility
  • TA - Technical Analysis. This information was available for the first years.
  • Date for Dividend - Only available for later stocks
  • Date for report - Only available for later stocks

I will start by scanning one file and extract the values.
The first line is the header. If that header string hasn't been detected before, the program will add that header to a list of headers.

The other lines contains the stock data and I'll parse them to parseRecordToDatabase that extracts the relevant data and creates a SQL query that adds the record to the database.
 I will use a switch case to identify the different headers.
 I will split the each line of the file into the different data points and do some initial integrity checks of the data.
After the checks, I will create a SQL query string to enter the data to the database. I'll parse that string to my database handler.

Next steps:
  • Add counters for the number of records that I was able to decode and add to the database
  • Add two case clauses for the other two types of input data
  • Add checks for the input data for errors
  • Analyze a file only if the corresponding date doesn't exist in the database.
  • Refactor and clean up code

Saturday, 4 May 2019

StockAnalyzer: My Data and Some Stock Theory

As I've stressed several times before, this blog describes my learning curve in programming. If you find errors or areas where I have misunderstood the concepts that I explore, you are welcome to comment or contact me.

My Understanding on Stocks
In theory, it is very easy to tell the value of a stock. Sum upp all future dividends that the stock will generate and compensate for future inflation et voilà! - you have the value of that stock. The problem is obviously that no one has that information. Instead, pricing and valuation of stocks is a subject of debate and drives all stock trade.

When a stock trade takes place. two actors has different ideas of the value of that stock: The seller thinks that the stock is so high that he/she prefers money instead of that stock. The buyer thinks that the same price of the same stock is so low that he/she prefers the stock instead of money.

The Efficient Market Hypothesis is central in this subject. Put simply, it assumes that all relevant  information about the stock is already reflected in the stock price. Based on that theory, it would be impossible to systematically outperform the stock market.

The Weak Efficient Market Hypothesis indicates that the stock/asset prices will be adjusted to the available information in the long run. However, there may be short-term biases that can be used to outperform the market, according to the theory.

Technical Analysis is another field in financial analysis that tries to predict future stock prices based on past stock prices. The opposite is fundamental analysis that focuses on the company and how it is doing, competitors, assets, returns etc when predicting the stock price.

My personal hunch is that Technical Analysis is too much of magic for me and that the crowd is doing a better job than I am when evaluating stocks. I lean more to a form of efficient market hypothesis and I use low-cost index funds for my limited investments.

I consider my project more as an exercise in machine learning, time series analysis and correlation studies than a way to make money on stock-picking.

My Data
The data that I collect is:
  • Name
  • Name (again - a feature from the early versions of the web scraper)
  • Price
  • Earning per share
  • Price per earning (redundant - can be used for checks)
  • Capital per share
  • Price per capital per share (redundant - can be used for checks)
  • Returns per share
  • Dividend (redundant - can be used for checks)
  • Profit margin
  • ROI
  • Date for dividend - This data was not collected in the first years of web scraping
  • Date for next report - This data was not collected in the first years of web scraping
The data is separated by semicolons.  

Some fields are empty. 
I collect the data from an online business newspaper using a web scraper. When dealing with real-world data, one brutal insight is that the data isn't always perfect:
  • The stocks are sometimes splitted (one old stock is divided into several new stocks)
  • The format of the data is changed on the target web page
  • Data is sometimes missing. For example, the dividend is sometimes missing.
I will likely discover more issues with the data in future blog posts.

The next step is to create a Windows app in Visual Studio using C#


Saturday, 27 April 2019

StockAnalyzer: Applying Machine Learning on Stock Information

After using some neural networks to analyse a small set of data for a friends pet project, I will focus on my own data.

I have a web scraper, StockReader, that collects some information about public stocks that are listed in Sweden. That has been in use for eight years and I have more than 1500 snapshots of a couple of hundreds of stocks.

It was originally written in C++ (the code was terrible, but it was essential for me to learn to build a more complex program) and I later ported that to a twenty-four line python script that is scheduled to run three times a week.

Now, I want to use the data to learn more about machine learning and analysis of time series. I also want to get experience from C#/Visual Studio and Angular JS.

I don't expect to find a magic algorithm  that helps me in stock-picking. The purpose of this project is to learn coding, machine learning, C#, Visual Studio and Angular JS.

The Different Technology Areas for the Project
The data is saved in csv files (comma separated values). The data includes stock price, earnings per share, dividends, profit margin, RSI and date for the quarterly reports.

I will create a Windows program based on C# in Visual Studio to populate a mySQL database with the stock data. It would probably be easier using Python but I want to explore new tools and programming languages.

After the data is in the database, I will build a web app using Angular JS, That program will check the data and search for possible stock splits and inconsistent data.

Once the data is corrected, I will analyse it. Since Python has very powerful AI packages, I will use Python to extend the web app above.

I will start by describing the data and some relevant topics for stock markets.

Saturday, 26 April 2014

StockReader: Motivation and Background

This software has evolved gradually, and from the beginning I had no intention to make this kind of software.

A couple of years ago, I started to invest in stocks. After some painful experiences from the "buy-when-someone-recommends-a-stock"-period, I tried to be more systematic. I wanted to rank the stocks after some key numbers in order to automate the initial screening.

I created a spreadsheet document where I entered some key numbers for stocks, such as dividends, price/earnings, earning marigin, stock price, net asset value and some more parameters. Updating those values by hand was a very time consuming task, even for a very small number of stocks.

The next step was to experiment with linking to external webpages in OpenOffice. I found that task very time consuming too, as the incoming data spanned over different areas each time – sometimes, that data occupied five rows, sometimes seven rows. That brought a lot of work to adjust the spreadsheet. Also, it took OpenOffice some two to tree seconds to fetch the data (with a good internet connection).

The final step was to build a C++/Qt program that downloaded the stock data, analysed it and sent it to a csv file. My stockList spread sheet linked finally to that document. Now, it takes my quite-slow-and-quite-old computer some 80 seconds to download and update the stock information (12 data fields per stock) of some 300 stocks.


Saturday, 19 April 2014

Lecture Notes: Financial Markets (Swedish notes)

Here are the lecture notes from my second course in National Economics: Financial Markets.

The notes are unfortunately in Swedish (I had no thoughts about blogging initially) and are meant as an inspiration. I recommend any student to write his/her own lecture notes him/her self.

The PDF file can be found at:
https://dl.dropboxusercontent.com/u/3587964/FinansHansBystrom.pdf

As before, I can guarantee that there are logical and factual mistakes, missing pieces and other flaws. However, I passed the exam with a good grade.

Saturday, 12 April 2014

StockReader: Bringing Hundreds of Stocks to one Spreadsheet

My other project is StockReader. That program scans key numbers from some three hundred Swedish stocks and makes that data accessible from a spread sheet program.

That program analyses stock data from some web pages, extracts the interesting information and arranges it in a comma-separated-value file that is linked to a spreadsheet, where I can rank the stocks after some criteria.

This way, I can assign different points/grades to stocks, depending on how they perform with regard to, for example the price/earnings value. Companies with big losses will get a "bad" grade, and companies with good earnings will get a "good" grade.

The final result of the program: Stock data collected to a Spreadsheet
After summing the grades for each key number, I can easily identify the companies with high dividends, good earnings, good net asset values, ... After having my computer doing all the dull work, I can continue with cherry-picking the best stocks.

Nowadays, I am advocating the efficient market hypothesis, meaning that all public information about assets will be reflected by the price. So stock-picking will be more of a hobby for me with no intentions of beating the market.

I've learnt a lot when creating the program and I want to share it with my readers in future posts.