This page describes my Stock Analysis project. I have been saving stock data for ten years using a couple of web scrapers and I want to do some data analysis/machine learning on that data to see if there are any patterns.
The code below is not available on public code repos. The userbase is very limited - for my personal use only.

StockReader is a web scraper that scans key numbers for hundreds of Swedish stocks.
The program was originally written in C but later rewritten into Python.
The early versions of the web scraper were unable to handle flaws in the scraped website and I've had to spend a lot of time post processing the data. Note to self: Verify the scraped data immediately when scraping.
StockToDb casts the records to a SQL database. It is written in C#.

It scans the files that are matching the time interval and tries to extract stock information/key numbers. If the data is OK, it will add the data to the database.
Step 2: Fix issues in raw data. Useful scripts:
https://github.com/cutetrains/StockToDatabase
source\repos\StockToDatabase\StockToDatabase.sln
INPUT: stock record csv files
OUTPUT: Database
Step 6: Run generateTXVData.py or generateTXVDataHistoric.py to create training and test data.
python generateTXVData.py
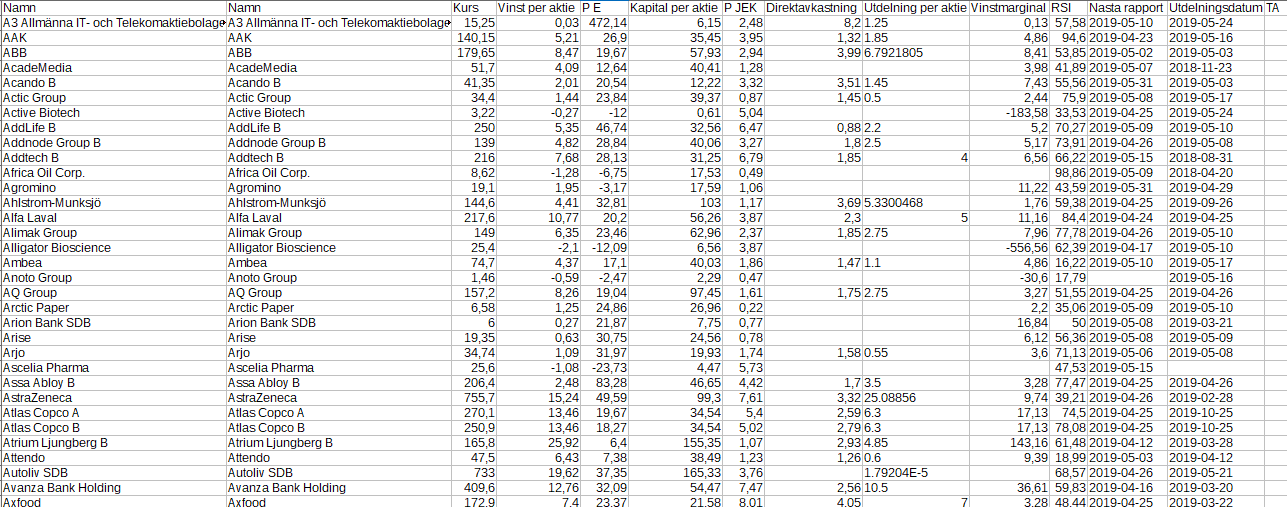 |
| The set of key numbers for one stock and one day is named a record. |
The early versions of the web scraper were unable to handle flaws in the scraped website and I've had to spend a lot of time post processing the data. Note to self: Verify the scraped data immediately when scraping.
StockToDb casts the records to a SQL database. It is written in C#.

It scans the files that are matching the time interval and tries to extract stock information/key numbers. If the data is OK, it will add the data to the database.
There are a few Python scripts that can help fixing the data:
- recordEndingWithNextStockNameFixer.py - This script fixes an issue where the newline is misplaced in the raw data file.
- addNumberForStockAtDate - This script adds a specific number to the stock record for a specific stock, at a specific location in a specific range of dates. There are also some checks for the original data to reduce the risk of modifying the wrong data.
StockAnalyzer will use the database to analyze the data and check for errors. It is written in Python.
StockAnalyzer will both present a number of graphs of how some key numbers are evolving over time.
StockAnalyzer will also perform an automated scan of all key numbers for all records over time in order to detect flawed data, where the data formats are OK, but the numeric values appear to be invalid. This will be done later.
StockToDatabase (C#) populates a database with the stock records. It also adds some checks for the data.
predictStockPriceNN predicts the stock prices and checks the correlation between the predicted performance with the real performance.
Workflow:
Step 1: Run web scraper on a regular basis.
python Dropbox\Ekonomi\StockReader\StockReader2.py
python Dropbox\Ekonomi\StockReader\StockReader2.py
INPUT: None (internet connection needed)
OUTPUT: CSV file with the stock records of today
Step 2: Fix issues in raw data. Useful scripts:
- addNumberForStockAtDate.py
- excludeLineCommandGenerator.py
- recordEndingWithNextStockNameFixer.py
https://github.com/cutetrains/StockToDatabase
source\repos\StockToDatabase\StockToDatabase.sln
INPUT: stock record csv files
OUTPUT: Database
Step 4: Search for splits
python Dropbox\Ekonomi\StockReader\searchForSplits.py
INPUT: Database
OUTPUT: splitlist.csv
python Dropbox\Ekonomi\StockReader\searchForSplits.py
INPUT: Database
OUTPUT: splitlist.csv
Step 5: Generate index for comparison.
For two existing dates, find all stocks that have are present in both dates.
Calculate the average of value growth (P/P_old). This is done simply by downloading OMXS30 Data.
For two existing dates, find all stocks that have are present in both dates.
Calculate the average of value growth (P/P_old). This is done simply by downloading OMXS30 Data.
Step 6: Run generateTXVData.py or generateTXVDataHistoric.py to create training and test data.
python generateTXVData.py
INPUT: Database and splitlist
OUTPUT: Training data
Step 7: Run predictStockPriceNN.py or predictStockPriceNN_Historic.py and check whether error is reducing or not.
INPUT: Training and test data sets of stock records.
INPUT: Training and test data sets of stock records.
No comments:
Post a Comment