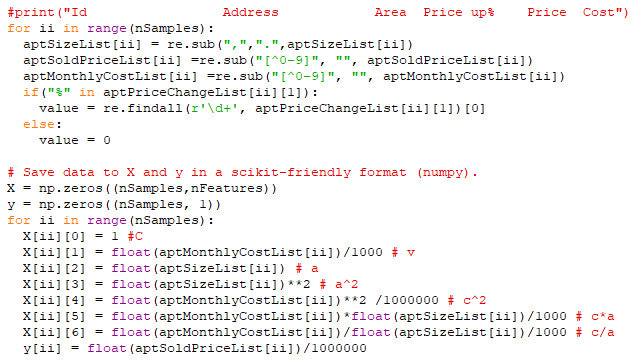
The bitmap below reflects whether or not the model contains some features (whether some theta values always should be zero or not):

One test run of the model looks like this:
 |
| First, some characteristics of the y data set (final prices) The bitmap reflects which of the features should be included in the model. The MSE and MAE are shown for different sizes of training set/test set. The best feature sets are recorded, both for MAE and MSE |
The standard deviation of the price is 360 kSEK. When training different sets of features for different training sizes, the Medium Absolute Error is between 210 kSEK and 280 kSEK.
For example, when using a bitmap of 1010101 (considering constant, cost, area^2 and cost/area) and training it for 40 samples and testing on 10 samples, the average MAE is 217 kSEK. In this case, I repeated each bitmap/training set size for 100 times. This means, that I can make better predictions on the final prices using this program, compared with just guessing.
For one specific apartment that is for sale, the model predicts 2.1 MSEK +/- 0.2 MSEK. Time will tell what the actual price will be.
How to Evaluate the Performance of Linear Regression
For example, when using a bitmap of 1010101 (considering constant, cost, area^2 and cost/area) and training it for 40 samples and testing on 10 samples, the average MAE is 217 kSEK. In this case, I repeated each bitmap/training set size for 100 times. This means, that I can make better predictions on the final prices using this program, compared with just guessing.
For one specific apartment that is for sale, the model predicts 2.1 MSEK +/- 0.2 MSEK. Time will tell what the actual price will be.
How to Evaluate the Performance of Linear Regression
Initially, the linear regression algorithm operates on some training data. It estimates the error by adjusting the parameters using the gradient. It is repeating that, over and over and over again.
When this is done, one should use the model to make predictions, and to compare those predictions to the actual data.
Error Metrics - There are several ways to estimate errors of predictions. There are plenty of articles that are discussing which to use and when. I'll compare both the Mean Squared Error and the Mean Absolute Error.
The advantage of MSE is that it will punish big errors but on the other hand, it is not so robust to outliers.
Number of Features
The simulations suggest that there is no big difference between different sets of features, except some poor combinations. For example, using only the constant gave a pretty bad predictor with an MAE of 280 kSEK.
Size of Training Set
A machine learning application would need thousands, if not millions of data.
For apartments, there are two ways to increase the number of examples:
A machine learning application would need thousands, if not millions of data.
For apartments, there are two ways to increase the number of examples:
- Use a larger geographical area. The problem is that prices depend on the location, which would add complexity to the model. Two similar apartments will have very different prices, depending on their address.
- Use a longer time interval. This is also tricky - a data set covering a longer period of several years will be affected by price changes in the market.
I'm afraid that I'll have to live with the imperfection in the model.
This concludes the project ApartmentPredictor. For the next blog post, I'll focus on stocks again.