Showing posts with label StockAnalyzer. Show all posts

Saturday, 2 January 2021

2020 in Retrospect

2020 was a dramatic year for me and that had some impact on my pet projects. 

The first wave of the pandemic came when I and my family moved to our current home in Åkarp. Luckily, that didn't affect the relocation and the contractors we used for fixing things in the house.

We got our second son when the second wave was escalating in December. 

The pet projects still had some progress:

StockPredictor (C#, Python, SQL and Machine Learning): I created a Python script that connected to the SQL database and analyzed the data, for example identifying stock splits. I also made some improvements to the web scraper. After several months of work with the data, I was able to apply some machine learning algorithms to the data. As expected, the MLPRegressor wasn't able to predict future stock values - it seems that the market is quite efficient.

IOT (Arduino, Raspberry PI): I explored Arduino and followed some simple experiments to learn the basic concepts. After that, I created a simple set of traffic lights with an emergency button and a LCD display. For Raspberry PI, I brought up the system.

In 2021, I'll mainly focus on the house, work and family.  I still think I can have some progress on my pet project in IOT.

Saturday, 24 October 2020

StockPredictor: Using Neural Networks to Try to Predict Stock Values

With the verified training data, I've been trying to predict stock performances, given some key numbers. 

I'm using the scikit toolbox for Python and the initial findings is that the neural network hasn't been able to predict the stock performances. The correlation between the predicted values and the target values is close to zero. 

Findings
I've run several iterations with different parameters, like alpha (learning rate), random state, batch size and whether to use historic data or not. They all point to the same conclusion - there is no easy-to-catch pattern that the neural network can find. 

These finding support the efficient market theory - the past information is already priced into the current stock prices. 

The distribution of the result data is hard to model using a neural network. Most of the data is small, but there are some few outliers that generates large losses for the training function.

The result distribution. 95% of the results are in the range -0.0143 up to 0.0166,
but some outliers are much bigger.


For reference, I trained a neural network for a dataset that is available in sklearn (load_diabetes). That network found a quite strong correlation between predictions and the results (75%). This means that I know how to set up and use data sets for machine learning. 

Summary of the project and the future
I have no plans to continue the project at this moment. The web scraper will keep recording stock records and I'll update the documentation.

Lessons learned:
  • Verify the data early in the project!
  • Use standard schemes for saving the data. Preferably CSV format, and/or a format that can easibly be imported into a database.
  • Add checks for inconsistent data that notifies the operator.
Unplanned future work:
  • Map the results into an machine-learning friendlier distribution. Maybe logarithmic scale?
  • Iterate over different prediction windows. Currently only 7 days is used.
  • Use other algorithms, like K-nearest neighbor.
For the end of the year, I'll explore Internet of Things (IOT) with Arduino and Raspberry PI. The train project will continue in 2021.

Saturday, 10 October 2020

StockPredictor: Exploring the MLPRegressor

I want to predict stock prices using existing data. Optionally, I'll convert the problem into a classification problem ("to buy or not to buy). With the training data in place, I'll explore the Python package scikit-learn.

This article discusses some machine learning algorithms that can be used to predict a numerical value. Neural networks and K-nearest neighbors seems promising. I suspect non-linear relations between features and results, so I don't expect linear regression to work. However, I'll give it a try later.

Multilayer Perceptron Regressor

I based my program on the examples above, with my data from StockReader. 
After training the neural network on ~210 000 examples, I test it on ~50 000 examples. I compare how the neural network is doing with an dart throwing monkey (a simple prediction that the stock performances will be the average daily price increase of the stocks).

The initial output from training the neural network together with verifying it on the test data shows no improvement compared to the monkey. The Median Average Error for the Neural network was 0.095, compared to the benchmark of 0.064. 

The next step will be to investigate other parameters for the neural network, along with other algoritms. Since I will compare different models, I will need to introduce cross validation data. This is important, since I need to make sure to verify the model selection itself.


Useful link:

Saturday, 12 September 2020

StockPredictor: Selecting Algorithm and Some Design Considerations

This is the third part of the stock project, where I will use the validated data to train a machine learning system to predict the performance of a stock based on the data that was available at the date of the stock record.

The first step is to make some design considerations for the algorithm. The earliest program will only look at the current stock record for features (X) and the results (y) will be the daily change of the stock.

If I select the prediction window to one week, one example of features and results would be:


The results from a query in the database will look like this:

The X data can consist of values of P, P/E, P/C, Yield, PMI, RSI and the time to/since the last dividend. The y data for the stock record of 2018-10-31 will be the change (%) divided by the days: 
The daily increase of ABB's stock price was 0,054% during one week in November, 2018.
It would have been more mathematically correct to take the seventh
root of the quota, but this time I'll prefer simplicity.

For training data to be useful, there must be a price record in the future that can be used ad y.

I'm saving the data to a huge panda dataframe (the process of populating it from the database (with some necessary processing) takes ~35 minutes. To avoid repeating this cumbersome process every time, I save the dataframe to a csv file, that can be used directly to train the machine learning algorithm. Loading that file takes less than a second.

The Data Set
I suspect that some of the data are highly correlated to each other. For example, Price, P/E and P/C are correlated in the short-term, since earnings and capital per share seldom changes. 

Sometimes, the data contains zeros or null values. 

Regression or Neural Networks

Both regression and neural networks has some pros for this dataset. 

Linear regression

A linear regression would be intuitive for predicting the change in stock price. But there are some zeros in the underlying data that I fear will skew the results. It also seems to be tricky to handle XOR relationships between features. 

Multi-Layer Neural Networks can model complex relationships such as XOR relations and zeroed records. I'll start with this one initially. The

SciKit-Learn

Sklearn has a neural-network-ish regressor that I will investigate.


Saturday, 25 July 2020

StockReader: Handling Broken Scaping

I've seen that the web scraper StockReader script sometimes halts due to various reasons. For example. it can be timeouts from the server.
The connection error is seen occasionally.

I'll handle this by running the script again and again until I get the data I need, while skipping the records that I've already collected.

The first step is to make StockReader check for existing files:

The second step is to acquire the stock names along with the stock ID's for the source web page. Using the names, I can tell whether the particular stock has a record or not. I did that using regular expressions in the script.


The third step is to open the file in read mode (if it exists), and store the contents of that file. After that, I'll close the file.

The fourth step is to open the file in append mode and iterate over all stock names, and fetch the stock data for the missing stock records.

The program works best if I run it some five times. Then it is likely that I'll catch most, if not all stock records for that day.

Issue:
For long stock names, the name is truncated in the web page that lists all stocks:
From the list of active stocks: A3 Allmänna IT- och..
From the in stock info web page: A3 Allmänna IT- och Telekomaktiebolaget
I resolved that issue by adding a second list of truncated stock names. If a stock was found in the truncated stock name list, I iterated over all stock names that already has a stock record. If one of those matched the stock name, the program didn't query that stock information.

Saturday, 11 July 2020

StockAnalyzer: Chasing errors

The work on Stock Analyzer will focus on two tracks in parallel:

  1. Fixing existing data to fit into the database (Scope of this blog post)
  2. Visual the data that is in the database
I see errors when the program is trying to parse values to the database. For example:


2017-06-05 - 2017-08-14: Unable to parse '2017-08-15'. 
2017-08-19 - 2017-11-01: Unable to parse '2017-11-07'
2017-11-06 and later: Unable to parse '2018-02-22'

The issue is that the program tries to parse a date into an integer since the date is on the wrong position in the file.

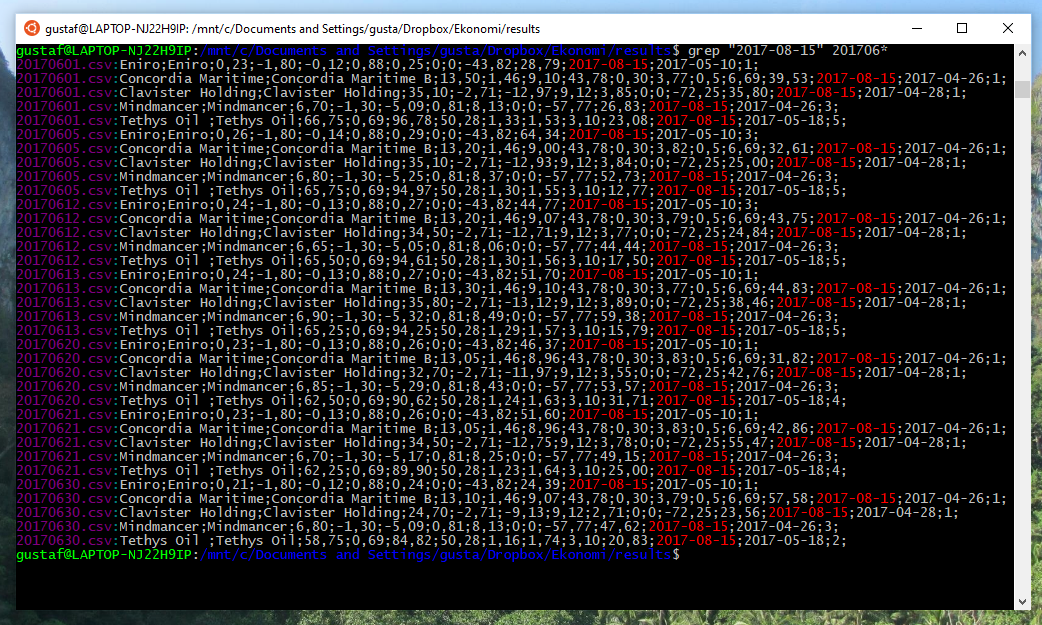
The first step is to check which stocks it could be that has the faulty data. I can easily do that using grep in my WSL2 environment on my Windows 10  computer.

The faulty data for June contains the string "2017-08-15".
This string is found in the following stocks:
Eniro, Concordia Maritime, Clavister Holding, MindMancer and Tethys Oil 
When importing the different stock records to a spread sheet to see which of the stocks are faulty.

Tethys Oil seems to have some missing data.
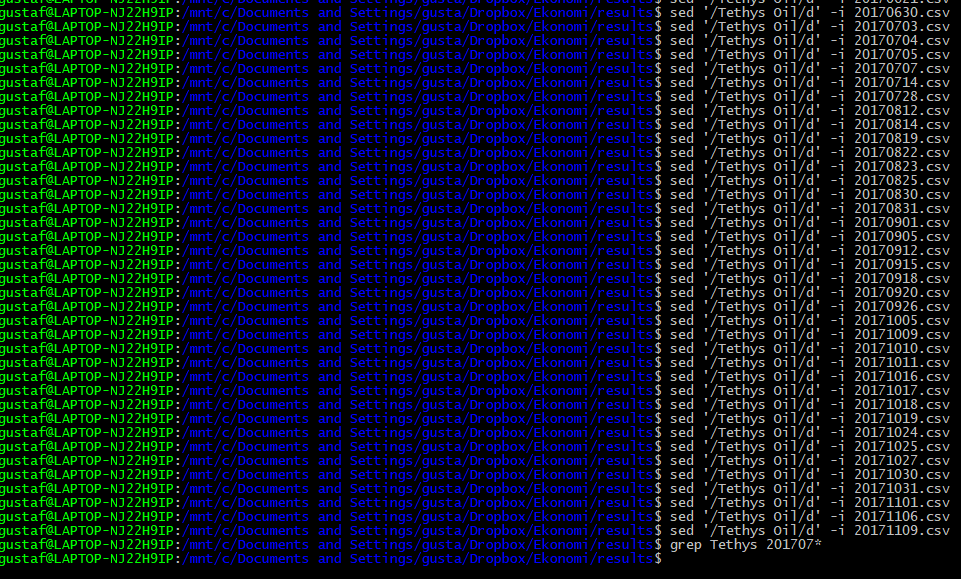
I did some maths on the remaining data to check if it is possible to recover the missing bits, but it wasn't. I'll simply remove the records for Tethys Oil for the missing period of time. A new grep instance gives:

This means that the stock records for the company Tethys Oil are corrupted between May 9th, 2017 and November  9th, 2017. Now, I want to remove those lines for the files ranging from 20170509.csv up to 20171109.csv.

For a given file, it is easy to remove lines containing "Tethys Oil":
sed '/Tethys Oil/d' -i file.txt
To identify the files in the desired age span, I tried to find a way to do lexicographic comparisons of the file names in the bash shell. It turned out not to be trivial, so created a Python script instead. 

The output are commands that removes all lines containing Tethys oil from the files in the interval. After pasting them to bash, the erroneous lines has been removed from the files.


Saturday, 13 June 2020

StockAnalyzer: Resuming Transmission

After focusing on global pandemics and relocations for the last months, I am able to resume focusing on my pet projects, but at a slower pace than before. I expect to post at least once per month.

I'll continue coding for the machine learning project StockAnalyzer.

Earlier this year, I explored NodeJS. I'll switch to Python instead, since it is more flexible and since I'm more familiar with it.

StockAnalyzer
I'll document the project in a separate page on the blog. The source code is available on my GitHub page.

StockAnalyzer will both present a number of graphs of how some key numbers are evolving over time.

StockAnalyzer will also perform an automated scan of all key numbers for all records over time in order to detect flawed data, where the data formats are OK, but the numeric values appear to be invalid. This will be done later.

Here, some key numbers are shown over time.
The graphs will help me find outliers and understand the data.
The first step is to present the data graphically - the vast amount of data will make it impossible to just look at the numbers.

Several of the curves appear to have identical shapes. The curves that relates the price to the earnings and capital will be similar to the price curve. This because the earnings and capital per share doesn't change very often. The yield is the dividend divided by the price and that is inversely correlated to the stock price.

In the next blog posts, I'll keep exploring the data.

In the following blog posts, I'll explore the data

Saturday, 22 February 2020

StockAnalyser NodeJS: Connecting to an Existing MSSQL database (1)

Important:
This blog shows my learning curve in different programming languages. Take my code with a large grain of salt.

The NodeJS script shall connect to an existing MS SQL database. This blog post summarizes some of the initial investigations to make this happen.

The connection string is:

The different components of the connection string are:
  • Integrated Security means that I am not using a username/password.
  • AttachDbFileName points to the file on the file system
  • Data Source refers to the MS SQL Server instance.
First step is to find and control the SQL Server software. Sometimes, it comes with the installation of Microsoft Visual studio. The software SQL Server Data Tools isn't included in my MSVC installation  (2017) and I need to add it using the MSVC installer.

The settings for my local database


Normally, the SQL Server Data Tools provides the server to other applications. For some reason I don't have it so I will install MS SQL Server on top of MSVC in the next blog post.

Saturday, 14 September 2019

StockReader: White and Black Lists

As I mentioned in earlier blog posts, I want to have a black list and a white list for combinations of expected name and returned names. Now, I got that code working.

An XML file lists all valid combinations (white list) and invalid combinations (black list). When the program is started, that XML file is opened and the lists are read into two dictionaries.

When the program finds a new stock record, it will query the class nameChecker for the combination of the expected name and the returned name. The result will be one of the following:

  • Found in white list: The record can be added to the database
  • Found in black list: The record is faulty and will be discarded.
  • Found in neither white or black list: The combination needs to be assessed by the user manually. The record won't be added to the database. Instead, a proposal xml string is printed to the console when the scanning of records is done.

One of the few methods that is properly commented.
I really need to refactor my code.
The output can be copied into the XML file for the next iteration:

This means that there will be a lot of manual work initially. Once the lists are updated, unknown mismatches will be less frequent.

The current version of the web scraper builds the list of stocks dynamically and mismatches should be very unlikely.

Side Note: I'm focusing more on programming tasks at work. Therefore, I'll have a slower pace on my spare time projects and sometimes, I'll update the blog every second week, instead of every week.

Saturday, 31 August 2019

StockAnalyzer: Adding XML Reader to the Program

I've created a separate page for StockReader and StockAnalyzer, with a short summary of the programs. In this blog post, I'll use XML and C# dictionaries to verify that the stock names are correct for the stock records.

When feeding the stock records from the csv files, I need to verify whether the stock name I queried (the first string) matches the actual stock record that I got (the second string).

As I mentioned in my last post, I'll have three lists of valid, invalid and unknown combinations in a XML file. The program will read that file and populate corresponding dictionaries.

When the program reads a stock record, it will look for the stock names in the dictionaries.
  • If it is found in the white list, that stock record can be added to the database.
  • If it is found in the black list, that stock record is ignored.
  • Otherwise, the program will print a recommended xml tag. The user can decide on whether to add that tag to the white or black list.
The user will edit the XML file and move combinations from the gray list to the black or white list manually.

XMLReader vs XMLDocument in C#
XMLReader is a read-only representation of the XMLDocument. The reader requires more code but is less memory consuming. I've decided to use the XML


New Class: NameChecker
The name checking will be handled in a separate class, that is called from fileParser. I'll implement it in the next post.

Mapping the Wanted Stock Name to the fetched Stock Name
In C#, there is no mapping from value to key in dictionaries. Key to value mappings are smooth. Therefore, searching for the key will be time consuming.

I'll use the dictionaries to search for the key (the fetched values). This will give a list of values that represent the wanted values (most of the cases one value).

Saturday, 17 August 2019

StockAnalyzer: Handling Stock Name Mismathes

One early flaw of the earlier versions of my webscraper was that it used hard coded links when retrieving the stock data. The links were based on hard coded numbers and I needed a safeguard check to detect if those numbers changed.

The program took the first Name ("Eniro") as the stock name. It used the corresponding numbers (869, 2398 and 46100341) to build three URL strings to fetch the stock data.

For that reason, I had the stock name as the two first entries: The first name is the stock that I want to fetch and the second name is the stock that was actually collected. Ideally, the names matched each other, but there are several mismatches.

I need to verify the stock records before adding them to the database. One check will be to see whether the first string is "---Void---" or not. That string was a placeholder and that record shall be discarded.


Further, I need to check whether the stock data I have really matches the stock name or not. To do this, I'll use a XML file that contains three lists:
  • White List for the allowed combinations of names,
  • Grey List for the combinations of names that hasn't been verified by the user yet and
  • Black List for the illegal combinations of names (these records will be ignored by the program).


A lesson learnt from this is to make sure that the web scraped data is in a good shape already when scraping. The next blog post will cover some XML topics for CSharp.

Saturday, 20 July 2019

StockAnalyzer: Fixing Flawed Data (continued)

My work on the program StockAnalyser is currently in a iterative cycle:
  • The program adds records to the database until it crashes because of some flaw in the input data
  • Fix that issue 
  • Repeat
This means that most of the blog posts for now focus on handling new cases of flawed input data. Please bare with me.

Each record is a line of comma separated values. For some records, one value is missing. By looking at the remaining data, I'm able to see what data is missing and replace that manually.

By adding a semicolon before the profit margin (in this case), the program will be able to populate the missing data with a null value.
Fixing hundreds, or thousands of records isn't possible to do by hand, and I'll need to create a script that can re-populate the missing data. I'll develop that script in the next blog post.

Saturday, 13 July 2019

StockAnalyser: Recovering Missing Data

In this blog post, I'll add code that protects the program when parsing strings to float values and I'll also add code that tries to recover missing information.

First, I'll add try-catch clauses to handle parsing errors from string to floats.

After that, I'll add functions to verify and populate null entries of the key numbers.

For the triplet of P, P/E and E. there are eight possible scenarios:
P = null, P/E = null and E = null - Impossible to recover
P = null, P/E = null and E != null -Impossible to recover
P = null, P/E != null and E = null - Impossible to recover
P = null, P/E != null and E != null - Recover P

P != null, P/E = null and E = null - Impossible to recover
P != null, P/E = null and E = !null - Recover P/E
P != null, P/E != null and E = null - Recover E
P != null, P/E != null and E != null - No need to recover

I'll start to count how many null values I have. If there are two or more null values, I can't recover any data. If there is no null value at all, I don't need to recover any data.

I will add two boolean flags later.
One will indicate if any data in the stock record has been recovered and
 another flag will indicate if the data is so bad that it shouldn't be sent into the database.
The screen shot below illustrates how the earning value is recovered (example from 2018-06-13, AAK, a Swedish company that is producing vegetable oil and fat.)


Similar functions are added for the Price, Price per Capital (P/JEK) and the Capital per share.

Now, only profit margin is missing. Since that is calculated as the profit (P) divided by the total revenue (not recorded), I can't recover that value. I'll simply parse "Null" to the database, if that is missing.


After fixing this, I was able to scan stocks until 2019-02-15. For that date, most of the information is missing.

The fix here is to add a flag that indicates whether the stock record contains sufficient information to be added to the database. 

Side note: The board of AAK decided to perform a 6:1 share split, where one old share generated six new shares. This explains why some data was missing for that date. The next project will detect and handle share splits.


Saturday, 29 June 2019

StockAnalyzer: Validating the Raw Data - Missing Price

In my last blog post, I was able to add data from July 2013 and later. Before that, the data has a different format and I will handle that soon.

I have seen that I will need to check the data before adding it to the database. Sometimes, data is missing and sometimes, the data comes in a different shape.

I will discuss the issues when I see them.

Missing Price Information:
The web site that I use displays the price (the price of the last transaction) if there has been any transactions that day. If no transactions has happened that day, the price field is empty.

If that number is missing, the parameter "P" will have the value null. However, it is always possible to calculate the price by multiplying P/E by earnings per share (E). I'll illustrate with a real-world example:

On October 9th, 2014, the trade in the Swedish company Eniro was halted by the stock exchange in Stockholm and the Swedish Financial inspection. For that day, all trade was halted for Eniro and there was no price quote for that day.

The stock price number is corresponding to Senast (Latest). Screen dump from June 2019. 
The screen shot above shows the web pages that I'm scraping. Most of the times, the fields are populated with data, but there are some exceptions. In the case of Eniro, the dividend (utdelning) and yield (direktavkastning) are omitted since there is no yield for that company. The webscraper interprets those fields to be zero.

Price is available for Eniro (10,19 SEK per share). The price corresponds to the the P/E (1,84) and Earnings per share (5,52) since 1,84 times 5.52 equals 10,16 SEK.  
On October 9th, 2014, price info was omitted. It is still possible to estimate the price using:

  • Price/Earnings rating, the Earnings per share and also 
  • Capital per share and the Price per capital:

On October 9th, 2014, no trades were done for Eniro.
As a consequence of that, there is no record of stock price for that date.
Multiplying P/E by E gives 6,77 SEK. 

 I expect this to happen very seldom, but I will add a row to the database that indicates when the price information is missing. The neural network will tell whether a missing price information will predict anything in the future.

Coding:
After fetching the stock record, all data are represented O as a string list. In this case, the string for price is empty, and string2Float thus returns null.


I added a function inside the method for scanning the stock record. That function is in the same scope as the other variables and can modify them.
 If P is null, P is recovered using P/E and E and a boolean parameter is set to indicate that the parameter was missing from the raw data.
 I have updated the database to include a bit telling whether the price information was missing in the stock record.
Now, the price is added along with an indicator of missing price. "1" indicates that the price is missing.

Saturday, 22 June 2019

StockAnalyzer: Scanning the Stock Files for Data

Now, I will start to interpret the data in the input files (YYYYDDMM.csv) and generate SQL commands based on that information.

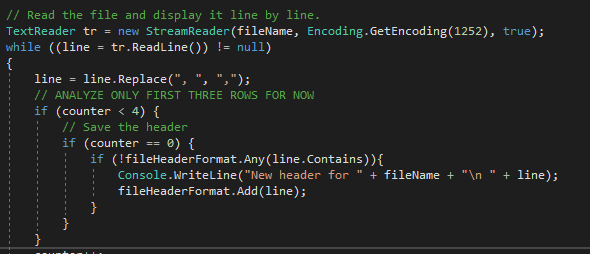
I will start by analyzing the headers of all the data files.

I collect all unique headers to a stringlist and print the contents to the console.

There is plenty of data but I will only use some of it. The data that is common for all three different kinds of versions are:
  • Name,
  • Price (P),
  • Earning per share (E),
  • P/E - This is redundant and can be calculated from P and E. I'll use this to verify  P, E and P/E values
  • Annual Dividend (D)
  • Stock Yield (D/P) - This is redundant and can be used to verify P, D and D/P
  • Capital per Share (C)
  • Price/Capital (P/C) - This is redundant and can be used to verify P, C and P/C
  • RSI - Indicator of volatility
  • TA - Technical Analysis. This information was available for the first years.
  • Date for Dividend - Only available for later stocks
  • Date for report - Only available for later stocks

I will start by scanning one file and extract the values.
The first line is the header. If that header string hasn't been detected before, the program will add that header to a list of headers.

The other lines contains the stock data and I'll parse them to parseRecordToDatabase that extracts the relevant data and creates a SQL query that adds the record to the database.
 I will use a switch case to identify the different headers.
 I will split the each line of the file into the different data points and do some initial integrity checks of the data.
After the checks, I will create a SQL query string to enter the data to the database. I'll parse that string to my database handler.

Next steps:
  • Add counters for the number of records that I was able to decode and add to the database
  • Add two case clauses for the other two types of input data
  • Add checks for the input data for errors
  • Analyze a file only if the corresponding date doesn't exist in the database.
  • Refactor and clean up code

Saturday, 15 June 2019

StockAnalyzer: Selecting the Input Files

Now, it is time to interpret the input files. They are named in the form "YYYYMMDD.csv" and contain a header row that describes the contents.

I need to consider some possible issues for the input data:
  • The file headers has slightly different formats since I have added some information in the later versions. 
  • The early versions of StockReader had hard coded references to the stocks. Thus, some stock records has sometimes slightly different names of the stocks. Sometimes, the companies changed names too. I need to add checks for the stock names, and possibly add a second table that maps different names to the same stocks.
  • Sometimes, the data acquisition was interrupted.

I'll start by selecting which files to analyze, based on the file names and the time interval that the user has specified in the dateTimePickers.

In order to do that, I use a built in function for removing the file path and the file extension. The remaining string contains the year, month and date:
Now, I process only one file.
Now, I want to check whether the corresponding date is within the time interval. For that purpose, I need to convert the string 20101110 to a datetime format. This is done in three steps:
Step 1: Check the file format - I'm only interested in comma separate value files.
Step 2: Check the date - I'm only interested in files that are corresponding to plausible dates.
Step 3: Convert the date to dateTime format and check whether the date is between the start and end date that the user has specified.
If all these checks are OK, the program will analyze the file. I'll do that in the next blog post.

Special Characters - ÅÄÖ
Since I am collecting data from Swedish stocks, I will handle strings with Swedish characters. I solved that by adding a streamReader object that is configured for the Windows 1252 encoding that contains Swedish characters.

As a side note, I added an UNIQUE constraint to the database. There can be only one record for one company at a particular date.