In my training data for the predictions, I use the following data to predict the changes in stock prices:
Stock Price, P/E, P/C, Yield, Price Margin, RSI and the number of days to dividend.
I want to be able to add historic key numbers as well and I'll specify that using bit masks,
Price
P/E
P/C
Yield
RSI
PM
RSI
Days to Dividend
Today
x
x
x
x
x
x
x
x
One week ago
x
x
x
Two weeks ago
x
x
x
Three weeks ago
x
x
x
x
Code (binary)
1111
0101
1001
1101
1011
0001
0001
0011
Code (Hex)
F
5
9
D
B
1
1
3
For simplicity, if one parameter is required two weeks ago, the script that generates the training data will add all parameters two weeks ago. The selection of parameters will happen in the prediction script.
There won't be matching historic dates for all stock records in the database. For the historic dates, I'll try the calculated date +/- one day.
If the current stock record date is on the 27th, I'll search for the one-week-old record on the 20th. If that date can't be found, I'll search for the 19th and 21th. If neither can be found, the program will give up fetching records for that date.
This means that the training set will be some 50% smaller. Removing half of the training set in order to train the neural network on what happened to stocks over the last weeks can, in theory, bias the underlying data. Assumption: I assume that the performance of the recorded stocks are independent on when I recorded the training data.
In the network trainer, the data that isn't used will be removed from the training set. The script will drop the columns that I don't need according to the bitmask.
The next step is to evaluate some machine learning algorithms on the data.
This year, I've had some progress on my pet projects. The progress rate was slower in Q4 as we have bought a house. We'll move there in 2020.
Maintaining a house will require some work and learning activities. I expect that the pace of my pet projects will be slower than before.
2019
TrafficControl (C++ / Qt) - Paused
No work on this project in 2019.
StockReader/StockAnalyzer (C# / SQL / MSVC) - Current focus
Creating a C# program that scans a folder for result files, extract stock records and parses the data to a database. I've got some experience with Microsoft Visual Studio by now and I'm still learning...
Next step will be to fix issues with data conversion to SQL
After that, I'll explore some Machine Learning algorithms and check if I can predict stock price changes based on key numbers.
ApartmentPredictor (Python) - Done
A Python script that made Linear Regression Analysis of past apartment prices in an area. The predictions were based on the apartment size and the monthly cost.
Machine Learning Course at Stanford (Octave / Matlab) - Done
I successfully attended and finished the course in Machine Learning from Stanford University.
I applied some machine learning for a pet project for a friend. The simulations indicated that the result was random to a very high degree,
I've completed the project now. TravelTimeCalculator allows the user to compare travel time/cost between several positions on a map. They can also customize the travel cost to consider both travel time, economic costs and environmental cost.
Work (C / Python / 4G / 5G) At work, I've focused on test and some coding for 5G with focus on antenna calibration.
Now, it is time to interpret the input files. They are named in the form "YYYYMMDD.csv" and contain a header row that describes the contents.
I need to consider some possible issues for the input data:
The file headers has slightly different formats since I have added some information in the later versions.
The early versions of StockReader had hard coded references to the stocks. Thus, some stock records has sometimes slightly different names of the stocks. Sometimes, the companies changed names too. I need to add checks for the stock names, and possibly add a second table that maps different names to the same stocks.
Sometimes, the data acquisition was interrupted.
I'll start by selecting which files to analyze, based on the file names and the time interval that the user has specified in the dateTimePickers.
In order to do that, I use a built in function for removing the file path and the file extension. The remaining string contains the year, month and date:
Now, I process only one file.
Now, I want to check whether the corresponding date is within the time interval. For that purpose, I need to convert the string 20101110 to a datetime format. This is done in three steps:
Step 1: Check the file format - I'm only interested in comma separate value files.
Step 2: Check the date - I'm only interested in files that are corresponding to plausible dates.
Step 3: Convert the date to dateTime format and check whether the date is between the start and end date that the user has specified.
If all these checks are OK, the program will analyze the file. I'll do that in the next blog post.
Special Characters - ÅÄÖ
Since I am collecting data from Swedish stocks, I will handle strings with Swedish characters. I solved that by adding a streamReader object that is configured for the Windows 1252 encoding that contains Swedish characters.
As a side note, I added an UNIQUE constraint to the database. There can be only one record for one company at a particular date.
It's been a while since I used Visual Studio, so I had to install a lot of updated.
Updating the environment takes time but is crucial for development.
I have spent too much time debugging issues that were solved with an update.
Since my version of Qt is dependent on Visual Studio, I had to rebuild TrafficControl and verify that it still works. Fortunately, it worked like a charm.
To learn about Visual Studio, I opened a simple example app that simply contains a text field. a button and a hyperlink:
The code is very intuitive: The main thread shows the form and the Form1 designer sets up the user interface element. In Form1.cs. there are some listeners to events such as a mouse click or a click to a hyperlink.
Adding a Database and a Data Source
First, I need to create a database. It is possible to use the Azure platform to do that online, but I'll create a local Microsoft SQL database instead. I followed the steps from the documentation.
Step 1: Select a local Database
Step 2: The database model shall be a dataset.
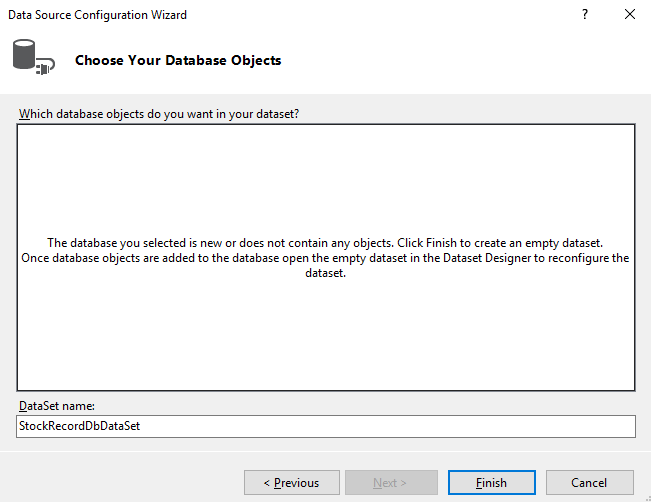
Step 3: Name the database object to StockRecord
Now, there is an empty database that I can use in my project.
The next step is to design the database itself and connect to it.
In the next blog post, I'll connect to the database from the program and populate it with some dummy data.
After creating an extremely simple neural network from an example, I've spent some time learning more about neural networks.
For the second project, I have 26 (or possibly 39) input data points per sample. Those inputs values shall map to one output value. I want to investigate whether it is possible to predict the order of magnitude of that output value.
I have no clue how (or if at all) the input is related to the output. It is very likely a stochastic process, but I want to see if a neural network can find any connection or predictability between input and output. For this example, I need something more advanced than a single-layer neural network.
A single-layer neural network has some built-in flaws. For example, it can not model a XOR gate. A XOR gate is an exclusive or.
I'll use a two-layer neural network with 26 (or 39) input nodes, a hidden layer with 10-ish nodes and one output node.
26-10-1 layers.
The input nodes (input data) are on the lower part of the graph,
the hidden layer in the middle and the output on the top.
A simpler image will illustrate the connections
Each input is connected to each node on the hidden layer.
The hidden layer is connected to the input nodes with 26*10=260 connections. The output is connected to the hidden layer with ten nodes. This makes 270 connections that shall be updated for each iteration. The First Sessions Using the Neural Network
I arranged the input data in the form of a matrix (a numpy array of arrays) where each row contains one set of input data. Since the script that I used could handle matrixes, the calculations were done very quickly - all sets of input data were calculated simultaneously.
It took the algorithm 1.7 seconds to perform 60 000 iterations of 30 sets of input data, each containing 26 floats. The machine that I use has a i5-8250U/1.6GHz CPU with 8 GB RAM - a low-end laptop.
Samples 1-30 are the training set. The last eight samples are the test set.
I missed five out of six "High" values, and I missed one of two "Low" values.
The confusion matrix indicates that I'd be better off guessing. Since I know that chance is a very big part of the results, I'm not surprised. The algorithm has told me that the output is likely not predictable.
When increasing the hidden layer from 10 to 20 neurons (two times more complex), the algoritm needed 2.2 seconds to complete. So it is clear that well-crafted algorithms (like the one created by Milo) are essential.
This time, I missed four of six "High" values in and one of two "Low" values in the test set.
From the results, it initially seems that the neural network fitted successfully to the training set (row 1-30). When predicting the test set, the network performed poorly. This looks like an overfitted neural network. I start to doubt whether it is possible to predict the outcome using the input data, but I will do some more attempts.
Lessons learned:
Execution speed depends a lot on the implementation. Arranging input data into matrices and clever use of built in functions will be crucial for this project - master your Python-Fu!
Neural Networks are tools that can try to adopt a couple of matrices to a set of learning data. If the data is flawed (too little data, biased data or random data), the outcome won't be better than the input data.
Next steps:
I need to get a better understanding on how the size of the hidden layer will affect the output - what happens with a very small hidden layer (approaching a single-layer neural network)? And what happens when I add many nodes in the hidden layer?
I will also rearrange the input data to see if the neural network will be more successful analyzing decreasing series of likelihoods.
So far, I have a threshold to distinguish "low" outputs from "high" output values. I need to learn how to make a neural network predict a value on a continuous scale instead.
In the book The Pragmatic Programmer, a programmer used a rubber duck to help him understand his code issues.
He described his code to the duck, line by line, easy enough for a rubber duck to understand. After describing a couple of lines, he understood the issue himself.
I'll try to do this for a simple neural network program that I have. It is based on a tutorial for a very simple neural network:
The indata is weighted and summed up to generate a prediction. In the example
In the example above, a farmer uses a dataset of eight flowers that are red or blue. Each flower has a width and a length.
The length on the X axis and the width on the Y axis.
The training data consists of blue flowers (0) and red flowers(1).
The gray flowers are to be classified by the neural network.
I start by guessing the bias and the weight factors for the neural network.
After that, I iterate over all known flowers and estimate the color using the weights. I sum up the errors as a metric of the progress of the neural network. The new weights and bias are adjusted by calculating some derivatives (slope of a cost function).
Each iteration will try to bring the predictions closer to the target:
I ran the program several times for the same dataset but with different number of iterations over the training data.
Parameters
Flower 0
Flower 1
Training Data
Iterations
w1
w2
b
Prediction
Cost
Prediction
Cost
Cost
0 (guess)
-0.134
-0.033
-0.253
0.381
0.145
0.291
0.502
NaN
1
0.109
0.142
0.165
0.616
0.379
0.690
0.096
2.51
10
0.345
-0.334
-0.954
0.317
0.100
0.566
0.188
1.742
100
0.900
-0.530
-3.126
0.091
8.228e-03
0.598
0.162
1.394
1 000
1.576
-0.316
-5.865
21.51e-03
462-5e-06
0.713
82.45e-03
1.316
10 000
2.250
-0.102
-8.392
5.948e-03
3.538e-06
0.836
26.78e-03
1.316
10 000
2.250
-0.103
-8.391
5.945e-03
3.536e-06
0.836
26.73e-03
1.316
10 000
2.251
-0.106
-8.390
5.945e-03
3.534e-06
0.837
26.66e-03
1.315
100 000
2.907
0.120
-10.78
1.833e-03
3.360e-06
0.918
6.660e-03
1.239
1 000 000
3.547
0.373
-13.12
0.595e-03
3.543e-06
0.961
1.491e-03
1.192
As expected, the first iteration is basically a guess. It takes a lot of iterations to get predictions that are close to the actual values. For flower 0 (Blue), it takes thousands of iterations and for flower 1 (red), it takes hundreds of thousands iterations.
I also ran a prediction on the same training data but with a test flower that had a sightly shorter blade. For that flower, it was much harder to predict for the neural network (it said 51% red). As one can see from the training data, the rightmost gray (unknown) flower is surrounded by red ones. However, it is still possible that the blue ones in the middle can reach out to that flower. For the leftmost gray flower, it is easier to predict where it belongs.
Iterating hundreds of thousands of times takes some time. I need to find better ways to estimate the new parameters, such as optimizations and built-in functions.
I see three factors that will make machine learning difficult:
Machine learning takes a lot of computational resources.
The data is often imperfect due to bad sensors, operator errors and other factors
The world it self is often irregular with stochastic processes and unknown unknowns that will confuse the learning of neural networks.
Why code the algorithm myself instead of using any of the existing ones? The purpose of this experiment is to learn neural networks from the ground, not making cool predictions without understanding what I'm doing.
In the next blog post, I'll try to use some real world data to see if there can be any predictions of the outcome.
Now, I know how the database should be organised. For the implementation, I'll use Test-Driven Development that I described in an earlier blog post for TrafficControl.
The first step is to be able to initiate the database helper at all.
When trying to do that in a local unit test, I wasn't able to initiate the dbHelper class since I couldn't get the context for the app. The reason is probably that I need more resources such as a database that will require an Android environment.
Instead, I was able to use the context in an instrumented unit test. This will be much slower than running locally, since the test needs to be loaded into a real or simulated phone. After some dependency issues for the test APK package that I didn't see for the app, I was finally able to test a simple instrumented test.
In the test, I added a dbHelper that I didn't use. For the local unit test, that step caused a crash.
More information about Android testing can be found here.
The first Test-Driven Development test will be to add columns to the database and check if those columns exist.
In order to reduce the number of requests to Google Directions API for directions, my app will need to save and reuse old queries to an Android SQLite database.
A SQLite query for directions will handle the following information:
Origin Latitude
Origin Longitude
Destination Latitude
Destination Longitude
The mode of transportation (DRIVING, TRANSIT, WALKING, BICYCLE)
Travel Time in seconds
Travel Duration in meters
The app will search for coordinates to find existing queries. In order to reduce the possible coordinates to a feasible number of coordinates, I'll cast the coordinates to integers, after multiplying by 1000.
This means that the coordinate (13.00213121, 55.432923) will be converted to (13002, 55433). The highest rounded error will be:
After querying, the database will be populated with data for recently used directions.
Whenether the user makes a new query, the database will start by finding all results that has origin and destination coordinates that are matching the query. The swapped coordinates will also count as hits. The query (13012,55605, 13002, 55605) shall find the directions above.
In the last blog post, I used a Google Directions API to get directions. In order to use more than one requests per day, an API key is needed.
API keys are used by applications to get access to several different online services.
Generally, it kind of cheap for Google Directions API: it will cost half a USD cent to query one api. Still, I'll need to reduce the requests for Google Directions and store the existing results to a local database. I'll elaborate more on that in the future.
When pushing my code to GIT, I need to make sure that no one will copy my key and freeload on my billing account. Luckily, this is easy to do.
As described by Varun Barad in his article at Medium.com, simply put the API keys in a file outside the GIT repo and point to that file using the Android gradle system.
For Python, it seems to be easier. Black Tech Diva has an instruction for that language.
Until now, the KML parser (trackStationConnector.py) expected the tracks to be in one folder, stations to be in another one and junctions to be in a third folder. This made it more difficult to use the program.
After the refactoring of the KML parser, the parser doesn't care where the tracks/stations/junctions are.
Placemarks are interpreted as below:
A placemark with only one coordinate will be seen as a station or a junction.
If the name of that placemark starts with an uppercase "J" and the second character is also uppercase, that placemark is a junction. Example: "JHyllieS".
Otherwise, it is a station. Example: "JerusalemC".
A placemark with more than one coordinate is a track.
If the name of the track starts with "d", it is a double track. The parser will create two parrallel tracks. Example: "dLun-Sta" becomes "dLun_Sta_N" and "dLun_Sta_S".
I used regular expressions in the new script. There is some more work with this script and I'll elaborate more about that in future blog posts.
I added a help section on the program, and that was quite easy!
In the user interface form (trafficcontrol.ui), I added an action (actionHelpOverview) in the help menu. That action was connected (SIGNAL/SLOT) to a slot that opens a web page in the default browser in the system.
The existing help pages are quite small - I don't want to have too much text and I want the program to be easy to use without reading too much documentation.
In the next blog post, I'll simplify the Python script that converts KML file to TrafficNetworkMap.
As mentioned earlier, the default path to the network files were hardcoded. This made TrafficControl dependent on having that particular folder on the particular computer, which is bad design. Instead, I used QStandardPaths to make the program look for the files in the user's home directory.
Further, I've modified the code for generating the TNM file. It is possible to select either a KML file, or a Traffic Network Map/File. In the latter case, the file is opened and parsed directly to the text field.
TrafficControl is setting up the UI and has many signal/slot definitions. I moved those to a separate function.
Finally, I deleted some objects in the trafficControl destructor in order to prevent memory leaks.
In the future, I'll need to add tet cases and error handling.
Before proceeding with the network designer, I need to plan where to add the new functionality,
One use case will be:
User selects a complex but valid KML file.
The python script trackStationConnector.py converts the file and displays the output on trafficNetworkDescriptionEdit.
If there are issues seen, the program should inform the user
If there are no blocking issues, the user can save the file and/or continue with using the train network that is now loaded.
Initially, I'll assume that the input from the user is correct. I'll add error checks later.
How it's done:
The button for selecting the KML file is associated with the action actionImportKmlFile. That action activates a slot in trafficControl that allows the user to select the KML file to import.
I have separated the code for selecting a file and the code that is opening the file for testability reasons. This way, I'll be able to open files in automated testing.
Here, the file path is hard coded. I need to have a generic default directory, such as the user's home folder.
Once the file is selected, it is opened from networkDesigner:
The program calls the python interpreter on the system, and parses the path to the python script as the first argument and the KML file as the second argument. This approach is very system-dependent and anyone that fetches my GIT repo must adapt this part. I need to fix tis issue in a later blog post.
All output from the python script is saved and parsed to trafficControl::updateTnmTextBox that is setting the text. It also parses the commands to networkControl so that the corresponding elements appears on the map. For testability, this needs to change so that the networkDesigner can communicate directly to networkControl using signals/slots.
Finally, the program saves the contents of the two text fields to one file.
This solution is hardcoded for my system. I need to make it more generic in future versions. Now, the program works only if puthon is installed on the computer, and the python path must be "c:/users/gusbra...".
For this summer, I'll focus on making TrafficControl demonstrable. During the last year, I've made a lot of improvements on the program:
I made the map useful, with symbols of tracks, trains and stations.
I refined the user interface, adding dock widgets and toolbars.
I added test cases using Google Test
I presented the system load and the simulated time to the program
The process of creating the input files is still manual and complex:
The user must create a KML file using Google Earth. Each track (polyline) must start and end at a station/junction (placemark).
The user must run a python script that extracts the coordinates for the tracks and stations and connects them.
The user must save the output to a file (TNM - Traffic Network Map).
The user must append information about the trains to that file. (TNO - Traffic Network Operations). The combined file is named TNF - Traffic Network File.
TNM is generated from the KML map. The TNF file is a combination of the TNM and TNO files. The user won't need to keep track of the different files.
I'll simplify and clarify this process in the program the new dockWidget Design Window.
The first step is to add an action that will let the user specify which KML file to convert to TNM format. Once that file is selected, TrafficControl will call a Python script that converts the file to the TNM format. The result is presented in the left textbox.
Until the user has imported a file, there is an explaining text in the text field.
After the script has been run successfully, the information about the stations and tracks has been created.
Future work:
Add error checking of TNF file and add TNO handling.
The solution is dependent on a Python installation on the users computer. Having an embedded Python interpreter would be better. This seems to be difficult to implement
The program is using some hard coded absolute paths to the script. I need to specify the file in relation to the program's working directory.
To be testable, the network designer must be independent from the user interface. I'll refactor the code and add signals/slots to communicate. For example, a signal will be trigged once the python script has converted the KML file to TNM format, so that the user inter face will be updated.
The script prompts for a URL to a house at a real estate portal.
Once the user has provided that URL, the script will fetch the house ad and analyse it using regular expressions.
The script searches for information using Regular Expressions, and adds them to a list.
Information about the local taxes are fetched from another web page, where I use the information about the town to get the tax rate.
Once that file is analyzed, I have almost everything that I need. The remaining information is an estimate of the travel time from the house to my work and from the house to my wifes work. I'll use Google Maps API and json to get this information.
Using Google Maps in a web browser, it is possible to get directions and estimates for travel time:
The information about the directions is sent to the web browser as a JSON (JavaScript Object Notation) object. I'll discuss how to get that data in detail in the next blog post.
When the script has run, the collected data is both printed on the console and copied to the clipboard:
Date, Address, Town, Starting Price, (Taxation value not available in ad), Number of rooms, Yearly maintenance cost, Construction year, Local tax rate, Living area, Other area, Garden area, Travel time for me, Travel time for my wife.
I now have a small family and we live in a small flat in Malmö. We don't plan to live like that forever, and therefore we are looking for houses in the area.
Some of the requirements for the house are:
Location (not too far from our work locations)
Price (both a total price and a cost per square meter and per month)
Local tax rates in the town we want to settle down.
I'm using a spread sheet to keep track of some houses, in order to see a price trend over time and to be able to compare between houses. Until now, I've entered the information manually:
Date when the add was published
Address
Town
Starting price
Taxation value
Number of rooms
Maintenance costs
Year the house was built
Living area
Other area
Garden area
Travel time from my work to the house
Travel time from my wifes work to the house
Final price (Updated when the house is sold)
Contract date (Updated when the house is sold)
Estimated renovating costs (A guesstimate based on the pictures and text in the ad)
Calculated monthly costs, both for 2% and 6% interest rates.
Some of the parameters can be fetched automatically. I've marked them in bold.
I use the parameters to estimate a monthly cost, and also a monthly cost per square meter. That cost is calculated as the sum of:
the monthly cost at an interest rate of 6%
the estimated need of renovations, multiplied by 4% and divided by 12,
the estimated increase/decrease in travel time, in terms of minutes per month multiplied by 3
the changes in local taxes and
whether the house is in Lund or not (with a penalty of 2000 SEK if it isn't in Lund). We love Lund and we want to live there!
Fetching all those parameters is a very time consuming task and in the next blog post, I'll try to automate some of them to save time.
The first button I added is replacing the "Continue with ticks" checkbox.
A QPushbutton was added and made checkable using setCheckable property, I connected the signal checked(bool) to a slot that is changing the icon of the button when it is clicked.
Left to right: Import Network button, Play/Pause and Step one second.
When the simulation is running, the play button is transformed to pause.
In the next blog posts. I'll add a menu, status bar and a tool bar to the program. Using that tool bar, the user should be able to hide and show the different dock widgets.
I aadded an indicator of the system load, defined as the time needed for simulating one second.
The time is measured in networkControl::stepTimeForNetwork as the time used between start and end of that function. The system load is calculated by dividing the computation time by the interval time.
For each tick, the results are shown in a textLabel on the user interface.
When running on my system (i5-8250, 8 GB RAM), three trains, the load is:
Debug version, PC in battery saving mode, average 5 ms, occasionally up to 15 ms.
Debug version, PC in performance mode, average 2 ms.
Release version, PC in battery saving mode, average 2 ms
Release version, PC in performance mode, average 3 ms
This means that there is room for bigger networks in the program
In order to make TrafficControl demo-able, there are some fixes I need to do for the user interface:
Simplify the time control buttons
Display the simulated time
Show the system load (calculation time divided by interval)
Simplifying the time control buttons:
The two spinboxes are not intuitive and should be replaced by only one spin box. The spinbox will contain a double parameter for the forward speed. If that is 1, one second in real time will correspond to one second in simulated time. If that is less than one, the network will move slower. If that is more than one, the network will move faster.
Whenever the value in the new spinbox is changed, a signal is sent to a slot:
The spinbox is defined to accept values from 0,5 to 50, so the check for non-zero denominators shouldn't be necessary. I added the check for futureproofing the code.
I'll discuss the other two changes in the next blog post.