Saturday, 4 May 2019

StockAnalyzer: My Data and Some Stock Theory

As I've stressed several times before, this blog describes my learning curve in programming. If you find errors or areas where I have misunderstood the concepts that I explore, you are welcome to comment or contact me.

My Understanding on Stocks
In theory, it is very easy to tell the value of a stock. Sum upp all future dividends that the stock will generate and compensate for future inflation et voilà! - you have the value of that stock. The problem is obviously that no one has that information. Instead, pricing and valuation of stocks is a subject of debate and drives all stock trade.

When a stock trade takes place. two actors has different ideas of the value of that stock: The seller thinks that the stock is so high that he/she prefers money instead of that stock. The buyer thinks that the same price of the same stock is so low that he/she prefers the stock instead of money.

The Efficient Market Hypothesis is central in this subject. Put simply, it assumes that all relevant  information about the stock is already reflected in the stock price. Based on that theory, it would be impossible to systematically outperform the stock market.

The Weak Efficient Market Hypothesis indicates that the stock/asset prices will be adjusted to the available information in the long run. However, there may be short-term biases that can be used to outperform the market, according to the theory.

Technical Analysis is another field in financial analysis that tries to predict future stock prices based on past stock prices. The opposite is fundamental analysis that focuses on the company and how it is doing, competitors, assets, returns etc when predicting the stock price.

My personal hunch is that Technical Analysis is too much of magic for me and that the crowd is doing a better job than I am when evaluating stocks. I lean more to a form of efficient market hypothesis and I use low-cost index funds for my limited investments.

I consider my project more as an exercise in machine learning, time series analysis and correlation studies than a way to make money on stock-picking.

My Data
The data that I collect is:
  • Name
  • Name (again - a feature from the early versions of the web scraper)
  • Price
  • Earning per share
  • Price per earning (redundant - can be used for checks)
  • Capital per share
  • Price per capital per share (redundant - can be used for checks)
  • Returns per share
  • Dividend (redundant - can be used for checks)
  • Profit margin
  • ROI
  • Date for dividend - This data was not collected in the first years of web scraping
  • Date for next report - This data was not collected in the first years of web scraping
The data is separated by semicolons.  

Some fields are empty. 
I collect the data from an online business newspaper using a web scraper. When dealing with real-world data, one brutal insight is that the data isn't always perfect:
  • The stocks are sometimes splitted (one old stock is divided into several new stocks)
  • The format of the data is changed on the target web page
  • Data is sometimes missing. For example, the dividend is sometimes missing.
I will likely discover more issues with the data in future blog posts.

The next step is to create a Windows app in Visual Studio using C#


Saturday, 27 April 2019

StockAnalyzer: Applying Machine Learning on Stock Information

After using some neural networks to analyse a small set of data for a friends pet project, I will focus on my own data.

I have a web scraper, StockReader, that collects some information about public stocks that are listed in Sweden. That has been in use for eight years and I have more than 1500 snapshots of a couple of hundreds of stocks.

It was originally written in C++ (the code was terrible, but it was essential for me to learn to build a more complex program) and I later ported that to a twenty-four line python script that is scheduled to run three times a week.

Now, I want to use the data to learn more about machine learning and analysis of time series. I also want to get experience from C#/Visual Studio and Angular JS.

I don't expect to find a magic algorithm  that helps me in stock-picking. The purpose of this project is to learn coding, machine learning, C#, Visual Studio and Angular JS.

The Different Technology Areas for the Project
The data is saved in csv files (comma separated values). The data includes stock price, earnings per share, dividends, profit margin, RSI and date for the quarterly reports.

I will create a Windows program based on C# in Visual Studio to populate a mySQL database with the stock data. It would probably be easier using Python but I want to explore new tools and programming languages.

After the data is in the database, I will build a web app using Angular JS, That program will check the data and search for possible stock splits and inconsistent data.

Once the data is corrected, I will analyse it. Since Python has very powerful AI packages, I will use Python to extend the web app above.

I will start by describing the data and some relevant topics for stock markets.

Saturday, 20 April 2019

Machine Learning: Using a Neural Network for Value Prediction

Until now, I've been using a Neural Network for a binary classification. Predicting a continuous value would be more relevant for my case.

I found an example that is using the sckit-learn package.

The Peer Project
This time, I've made some changes to the input data:

  • I will make the neural network train for the actual training output data instead of a binary representation of that data.
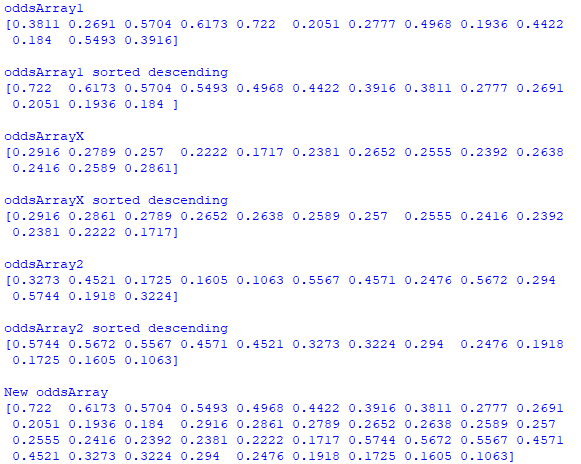
  • I will sort the training input data in three groups of thirteen values:
The values are initially arranged in triplets (likelihoods for events 1, X and 2) for thirteen samples. 
I sorted the array by descending values with a simple modification of the numpy sort command:

I use the MLPRegressor with some different random seeds and 10000 iterations.

The results are a bit disappointing. For some random seeds (and different sets of training/test data), the errors are smaller after 10000 iterations, compared to after one iteration.
Seed 300, 10000 iterations. 

Seed 400, 1 iteration

Seed 400, 10000 iterations

Seed 400, 1 iteration

The error messages are reoccurring and indicates that the convergence is too weak. It seems not to be any easy-detectable link between inputs and the magnitude of the output.  

Adding more iterations seems not to be the magical solution either.
For 20 000 iterations, the error is smaller than for 10 000 iterations.
But for 40 000 iterations, the error is increasing.
It seems that it is very important to be able to interpret the neural networks!

Checking a Known Data Set
As a sanity check, I've been training the MLPRegressor on a small training set:
This sample should be quite easy for an neural network to train.
I tested with a test size of 0.2 (6 or 7 samples in training set and 1 or 2 samples in test set):

One iteration:
The MLPRegressor wasn't able to converge after one sample.
This makes sense, since it takes quite a number of iterations to converge.
Ten iterations:
I still see the warning about convergence, but the errors are smaller.
This means that the algorithm is converging after all
A Thousand Iterations:
The error isn't shown anymore, and the errors are smaller now.
A Million Iterations:
Here, I'm running twice on the same setup.
The first optimization converged much more poorly than the second one.
The reason for this is probably an unfortunate selection of training data.  
Another optimization with a poor distribution of test and training data.
The training data contained all the "zeros", but the test data contained none.
This made a difference between the training and test data. 
The example above illustrates how important it is to have a big set of data to test and train on. 


I'll finish this part of my Neural Network project for now. The next project will start in the next blog post and cover much more training data. 

Saturday, 13 April 2019

Machine Learning: Tweaking the Hidden Layer

In the last blog post, I used a neural network with a hidden layer to try to predict a binary outcome based ion some input data. Now, I'll investigate how different sizes of the hidden layer will affect the output of the network.

Keep in mind that:
  • I'm learning about neural networks - this blog describes my learning curve and not recommended ways of handling neural networks.
  • Different shapes and depths of neural networks work for different problems, there is no "Golden" neural network.
  • The data I'm using for this example is probably random in the sense that there is likely no obvious connection between input and output.
10 Neurons in Hidden Layer:
(the setting from the last blog post): The neural network was well fitted for the training set, but worse than guessing for the test set.

1 Neuron in Hidden layer:
This is practically a single-layer neural network.  For the training set, the predictions are accurate for the "ones", but the predictions are 0.5 for the other values. This means that the neural network fails to predict "zero" at all. The prediction "0.5" can be seen as an attempt by the neural network to predict zero.
2 Neurons in Hidden Layer:
The predictions on the training set is better, but two predictions are still at 0.5 (samples 9 and 23). For the test set, the network is confident but wrong in six cases out of eight.

4 Neurons in Hidden Layer:
Now, the neural network fits to the training set (no errors). This has a similar confusion matrix as the neural network above, with 2 neurons in the hidden layer.

8+ Neurons in Hidden Layer:
The network is very confident all the times, but the test predictions are bad. This indicates that the neural network is well fitted to the training data (and that the sigmoid function is narrow enough to make the estimates ones or zeros). Adding more nodes makes the estimates more confident, but not more correct.
Matrix Calculations:
I've made a summary of the matrix calculations below:

Some Findings:
A neural network should have a general understanding of the input, and it should ideally be less confident.

This exercise illustrates one of the dangers with neural networks: it can generate very nice predictions that have low uncertainties, but fail to predict new data. It can give us an illusion of seeing patterns that doesn't exist. 

There is a risk that a sum-optimal neural network will tell us what we want to hear. This makes it very important to look at the results with an open and still critical mind set. 

Saturday, 6 April 2019

Machine Learning: Adding a Layer to a Neural Network

After creating an extremely simple neural network from an example, I've spent some time learning more about neural networks.

For the second project, I have 26 (or possibly 39) input data points per sample. Those inputs values shall map to one output value. I want to investigate whether it is possible to predict the order of magnitude of that output value.

I'll use the python code from Milo Spencer-Harber and his article.

I have no clue how (or if at all) the input is related to the output. It is very likely a stochastic process, but I want to see if a neural network can find any connection or predictability between input and output. For this example, I need something more advanced than a single-layer neural network.

A single-layer neural network has some built-in flaws. For example, it can not model a XOR gate. A XOR gate is an exclusive or.

I'll use a two-layer neural network with 26 (or 39) input nodes, a hidden layer with 10-ish nodes and one output node.

26-10-1 layers.
The input nodes (input data) are on the lower part of the graph,
the hidden layer in the middle and the output on the top.
A simpler image will illustrate the connections
Each input is connected to each node on the hidden layer.
The hidden layer is connected to the input nodes with 26*10=260 connections. The output is connected to the hidden layer with ten nodes. This makes 270 connections that shall be updated for each iteration.

The First Sessions Using the Neural Network 
I arranged the input data in the form of a matrix (a numpy array of arrays) where each row contains one set of input data. Since the script that I used could handle matrixes, the calculations were done very quickly - all sets of input data were calculated simultaneously.

It took the algorithm 1.7 seconds to perform 60 000 iterations of 30 sets of input data, each containing 26 floats. The machine that I use has a i5-8250U/1.6GHz CPU with 8 GB RAM - a low-end laptop.
Samples 1-30 are the training set. The last eight samples are the test set.
I missed five out of six "High" values, and I missed one of two "Low" values.
The confusion matrix indicates that I'd be better off guessing. Since I know that chance is a very big part of the results, I'm not surprised. The algorithm has told me that the output is likely not predictable.

When increasing the hidden layer from 10 to 20 neurons (two times more complex), the algoritm needed 2.2 seconds to complete. So it is clear that well-crafted algorithms (like the one created by Milo) are essential.
This time, I missed four of six "High" values in and one of two "Low" values in the test set. 
From the results, it initially seems that the neural network fitted successfully to the training set (row 1-30). When predicting the test set, the network performed poorly. This looks like an overfitted neural network. I start to doubt whether it is possible to predict the outcome using the input data, but I will do some more attempts.

Lessons learned:

  • Execution speed depends a lot on the implementation. Arranging input data into matrices and clever use of built in functions will be crucial for this project - master your Python-Fu!
  • Neural Networks are tools that can try to adopt a couple of matrices to a set of learning data. If the data is flawed (too little data, biased data or random data), the outcome won't be better than the input data. 

Next steps:

  • I need to get a better understanding on how the size of the hidden layer will affect the output - what happens with a very small hidden layer (approaching a single-layer neural network)? And what happens when I add many nodes in the hidden layer?
  • I will also rearrange the input data to see if the neural network will be more successful analyzing decreasing series of likelihoods.
  • So far, I have a threshold to distinguish "low" outputs from "high" output values. I need to learn how to make a neural network predict a value on a continuous scale instead.

Saturday, 30 March 2019

Machine Learning: Rubber Ducking a Neural Network

In the book The Pragmatic Programmer, a programmer used a rubber duck to help him understand his code issues.

He described his code to the duck, line by line, easy enough for a rubber duck to understand. After describing a couple of lines, he understood the issue himself.

I'll try to do this for a simple neural network program that I have. It is based on a tutorial for a very simple neural network:
The indata is weighted and summed up to generate a prediction. In the example
In the example above, a farmer uses a dataset of eight flowers that are red or blue. Each flower has a width and a length.
The length on the X axis and the width on the Y axis.
The training data consists of blue flowers (0) and red flowers(1).
The gray flowers are to be classified by the neural network.
I start by guessing the bias and the weight factors for the neural network.
After that, I iterate over all known flowers and estimate the color using the weights. I sum up the errors as a metric of the progress of the neural network. The new weights and bias are adjusted by calculating some derivatives (slope of a cost function).

Each iteration will try to bring the predictions closer to the target:

I ran the program several times for the same dataset but with different number of iterations over the training data.
Parameters Flower 0 Flower 1 Training Data
Iterations w1 w2 b Prediction Cost Prediction Cost Cost
0 (guess) -0.134 -0.033 -0.253 0.381 0.145 0.291 0.502 NaN
1 0.109 0.142 0.165 0.616 0.379 0.690 0.096 2.51
10 0.345 -0.334 -0.954 0.317 0.100 0.566 0.188 1.742
100 0.900 -0.530 -3.126 0.091 8.228e-03 0.598 0.162 1.394
1 000 1.576 -0.316 -5.865 21.51e-03 462-5e-06 0.713 82.45e-03 1.316
10 000 2.250 -0.102 -8.392 5.948e-03 3.538e-06 0.836 26.78e-03 1.316
10 000 2.250 -0.103 -8.391 5.945e-03 3.536e-06 0.836 26.73e-03 1.316
10 000 2.251 -0.106 -8.390 5.945e-03 3.534e-06 0.837 26.66e-03 1.315
100 000 2.907 0.120 -10.78 1.833e-03 3.360e-06 0.918 6.660e-03 1.239
1 000 000 3.547 0.373 -13.12 0.595e-03 3.543e-06 0.961 1.491e-03 1.192

As expected, the first iteration is basically a guess. It takes a lot of iterations to get predictions that are close to the actual values. For flower 0 (Blue), it takes thousands of iterations and for flower 1 (red), it takes hundreds of thousands iterations. 

I also ran a prediction on the same training data but with a test flower that had a sightly shorter blade. For that flower, it was much harder to predict for the neural network (it said 51% red). As one can see from the training data, the rightmost gray (unknown) flower is surrounded by red ones. However, it is still possible that the blue ones in the middle can reach out to that flower. For the leftmost gray flower, it is easier to predict where it belongs.

Iterating hundreds of thousands of times takes some time. I need to find better ways to estimate the new parameters, such as optimizations and built-in functions.

I see three factors that will make machine learning difficult:
  • Machine learning takes a lot of computational resources.
  • The data is often imperfect due to bad sensors, operator errors and other factors
  • The world it self is often irregular with stochastic processes and unknown unknowns that will confuse the learning of neural networks.
Why code the algorithm myself instead of using any of the existing ones? The purpose of this experiment is to learn neural networks from the ground, not making cool predictions without understanding what I'm doing. 

In the next blog post, I'll try to use some real world data to see if there can be any predictions of the outcome.

Saturday, 23 March 2019

Machine Learning Project

My next project will explore machine learning and neural networks.

I'll play around with some real data for a simple machine learning project, where I want to build a simple neural network to estimate the order of magnitude for four output numbers. The input will be thirteen pairs of float numbers between 0 and 1.

A simple neural network can look like this:
https://www.python-course.eu/neural_networks_with_python_numpy.php
The input are the yellow nodes, the internal layers are the green nodes and the output are the red nodes.

In my case, the input will be an array of 26 elements and the output will be an array of four elements. The size of the input may result in numerous matrix calculations, but it should be OK if I use the built-in algorithms for matrix multiplications.

I don't know what a good neural network looks like in terms of number of internal layers and their respective sizes. If the calculations are not too heavy, I'll just play around.

First, I need to learn the basics of neural networks in Python. I will start by following a basic tutorial and code the same network to get the basic concept.