Saturday 25 May 2019

StockAnalyzer: Connecting to the Database and Designing It

As I have mentioned before, I will process the data in three steps:
  • A C#-app for Windows that will populate the database (ongoing)
  • A web app that will analyse the database and look for inconsistencies
  • A Python script (or possibly Matlab script) that will perform machine learning on the data set.
In the last blog post, I created the database that I will work with. Now. I'll start populating it.

The first step is to connect to the database. I'll use an example that I found:

The language setting is Swedish.
For non-Swedish speakers, the error message
says that the key attachdbfilename is invalid.
The key attachdbfilename is invalid. The DataDirectory needs to be changed to an actual library. I'll start by fixing the connectionString and using a standard SQL query:

I can now connect to the database and launch a simple query!

The First INSERT and SELECT to the Database
I extended the query to the database. First, I populated the database with some dummy data. After that, I selected all rows in the database and presented them as a message box:
It shouldn't be possible to add more than one record of a particular stock for a particular date. I will add a UNIQUE constraint. I will fix that soon.

Next, I need to plan how to design the application, with different classes and layouts for the user interface.

Side Note:
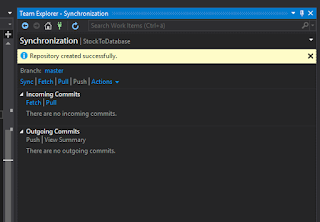
I added  the project to my GitHub account, using instructions on GitHub.


The updated code is available at https://github.com/cutetrains/StockToDatabase

Saturday 18 May 2019

Telecom: Some 5G Resources

A friend of mine asked me for some 5G resources. Here are a couple of them.

Obviously, I need to mention my employers resources on 5G.

Rohde & Schwarz is a Munich-based company that offers excellent expertise in the area:

They will release a 5G NR ebook soon, you can pre-order on their web site.

Niviuk is a web site that I use as a quick reference and for visualizing radio frames.

Edit: Sharetechnote has an excellent 5G section.

Saturday 11 May 2019

StockAnalyzer: Building the First C# Windows App and a Database

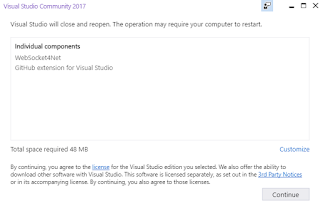
It's been a while since I used Visual Studio, so I had to install a lot of updated.
Updating the environment takes time but is crucial for development.
I have spent too much time debugging issues that were solved with an update.
Since my version of Qt is dependent on Visual Studio, I had to rebuild TrafficControl and verify that it still works. Fortunately, it worked like a charm.

To learn about Visual Studio, I opened a simple example app that simply contains a text field. a button and a hyperlink:
The code is very intuitive: The main thread shows the form and the Form1 designer sets up the user interface element. In Form1.cs. there are some listeners to events such as a mouse click or a click to a hyperlink.

Adding a Database and a Data Source
First, I need to create a database. It is possible to use the Azure platform to do that online, but I'll create a local Microsoft SQL database instead. I followed the steps from the documentation.


Step 1: Select a local Database

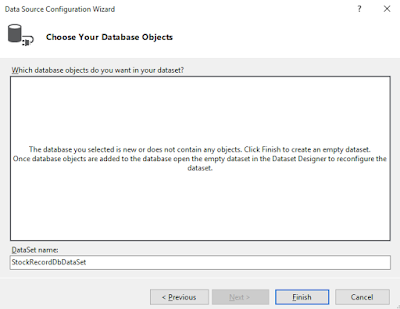
Step 2: The database model shall be a dataset.

Step 3: Name the database object to StockRecord
Now, there is an empty database that I can use in my project.

The next step is to design the database itself and connect to it.

In the next blog post, I'll connect to the database from the program and populate it with some dummy data.

Saturday 4 May 2019

StockAnalyzer: My Data and Some Stock Theory

As I've stressed several times before, this blog describes my learning curve in programming. If you find errors or areas where I have misunderstood the concepts that I explore, you are welcome to comment or contact me.

My Understanding on Stocks
In theory, it is very easy to tell the value of a stock. Sum upp all future dividends that the stock will generate and compensate for future inflation et voilà! - you have the value of that stock. The problem is obviously that no one has that information. Instead, pricing and valuation of stocks is a subject of debate and drives all stock trade.

When a stock trade takes place. two actors has different ideas of the value of that stock: The seller thinks that the stock is so high that he/she prefers money instead of that stock. The buyer thinks that the same price of the same stock is so low that he/she prefers the stock instead of money.

The Efficient Market Hypothesis is central in this subject. Put simply, it assumes that all relevant  information about the stock is already reflected in the stock price. Based on that theory, it would be impossible to systematically outperform the stock market.

The Weak Efficient Market Hypothesis indicates that the stock/asset prices will be adjusted to the available information in the long run. However, there may be short-term biases that can be used to outperform the market, according to the theory.

Technical Analysis is another field in financial analysis that tries to predict future stock prices based on past stock prices. The opposite is fundamental analysis that focuses on the company and how it is doing, competitors, assets, returns etc when predicting the stock price.

My personal hunch is that Technical Analysis is too much of magic for me and that the crowd is doing a better job than I am when evaluating stocks. I lean more to a form of efficient market hypothesis and I use low-cost index funds for my limited investments.

I consider my project more as an exercise in machine learning, time series analysis and correlation studies than a way to make money on stock-picking.

My Data
The data that I collect is:
  • Name
  • Name (again - a feature from the early versions of the web scraper)
  • Price
  • Earning per share
  • Price per earning (redundant - can be used for checks)
  • Capital per share
  • Price per capital per share (redundant - can be used for checks)
  • Returns per share
  • Dividend (redundant - can be used for checks)
  • Profit margin
  • ROI
  • Date for dividend - This data was not collected in the first years of web scraping
  • Date for next report - This data was not collected in the first years of web scraping
The data is separated by semicolons.  

Some fields are empty. 
I collect the data from an online business newspaper using a web scraper. When dealing with real-world data, one brutal insight is that the data isn't always perfect:
  • The stocks are sometimes splitted (one old stock is divided into several new stocks)
  • The format of the data is changed on the target web page
  • Data is sometimes missing. For example, the dividend is sometimes missing.
I will likely discover more issues with the data in future blog posts.

The next step is to create a Windows app in Visual Studio using C#