Saturday, 1 February 2020

Railroads: Four Tracks, Soon Near My Backyard

I've been busy with our future home in Åkarp, and therefore the blog has been quiet for a couple of weeks.

From April on, I'll be able to follow a very interesting railroad project closely. The Swedish Southern Main Line (Södra Stambanan) will be expanded from two to four tracks between Arlöv (5 km North East of Malmö) and one km south of Lund. The existing commuter stations Burlöv, Åkarp and Hjärup will be rebuilt, and Lund will get its fourth station, Klostergården (south of Lund C).

The first step is to build two temporary tracks, parallel to the existing tracks. After that, the old tracks are removed and the embankment is lowered six meters. Four tracks are added and finally, the temporary tracks are removed:
Initially, there are two old tracks on the ground level
Two temporary tracks are added next to the old tracks

A six meter deep trench for new tracks is built where the two old tracks were.
Four hundred meters of the tracks are covered in Åkarp.
A public park is planned to be put on top of the tunnel.. 
The temporary tracks are removed, and the bottleneck is resolved.
I'll explore this project further in future blog posts.

I'll write about this project alongside with my personal pet projects.

Saturday, 11 January 2020

2019 in Retrospect


This year, I've had some progress on my pet projects. The progress rate was slower in Q4 as we have bought a house. We'll move there in 2020.

Maintaining a house will require some work and learning activities. I expect that the pace of my pet projects will be slower than before.

2019
  • TrafficControl (C++ / Qt) - Paused
    • No work on this project in 2019.
  • StockReader/StockAnalyzer (C# / SQL / MSVC) - Current focus
    • Creating a C# program that scans a folder for result files, extract stock records and parses the data to a database. I've got some experience with Microsoft Visual Studio by now and I'm still learning...
    • Next step will be to fix issues with data conversion to SQL
    • After that, I'll explore some Machine Learning algorithms and check if I can predict stock price changes based on key numbers.
  • ApartmentPredictor (Python) - Done
    • A Python script that made Linear Regression Analysis of past apartment prices in an area. The predictions were based on the apartment size and the monthly cost. 
  • Machine Learning Course at Stanford (Octave / Matlab)  - Done
    • I successfully attended and finished the course in Machine Learning from Stanford University.
    • I applied some machine learning for a pet project for a friend. The simulations indicated that the result was random to a very high degree,
  • TravelTimeCalculator (Java / SQLite / Android Studio) - Done
    • I've completed the project now. TravelTimeCalculator allows the user to compare travel time/cost between several positions on a map. They can also customize the travel cost to consider both travel time, economic costs and environmental cost.


  • Work (C / Python / 4G / 5G) At work, I've focused on test and some coding for 5G with focus on antenna calibration.
To Do in 2020:
Prio 1: The New House!
Prio 2: StockReader/StockAnalyzer

Saturday, 21 December 2019

ApartmentPredictor: Evaluation an Linear Regression

The script is now "code complete" - I think that the code works, but I haven't verified it yet.

The bitmap below reflects whether or not the model contains some features (whether some theta values always should be zero or not):
One test run of the model looks like this:
First, some characteristics of the y data set (final prices)
The bitmap reflects which of the features should be included in the model.
The MSE and MAE are shown for different sizes of training set/test set.
The best feature sets are recorded, both for MAE and MSE
The standard deviation of the price is 360 kSEK. When training different sets of features for different training sizes, the Medium Absolute Error is between 210 kSEK and 280 kSEK.

For example, when using a bitmap of 1010101 (considering constant, cost, area^2 and cost/area) and training it for 40 samples and testing on 10 samples, the average MAE is 217 kSEK. In this case, I repeated each bitmap/training set size for 100 times. This means, that I can make better predictions on the final prices using this program, compared with just guessing.

For one specific apartment that is for sale, the model predicts 2.1 MSEK +/- 0.2 MSEK. Time will tell what the actual price will be.

How to Evaluate the Performance of Linear Regression 
Initially, the linear regression algorithm operates on some training data. It estimates the error by adjusting the parameters using the gradient. It is repeating that, over and over and over again. 

When this is done, one should use the model to make predictions, and to compare those predictions to the actual data.  

Error Metrics - There are several ways to estimate errors of predictions. There are plenty of articles that are discussing which to use and when. I'll compare both the Mean Squared Error and the Mean Absolute Error. 

The advantage of MSE is that it will punish big errors but on the other hand, it is not so robust to outliers.

Number of Features
The simulations suggest that there is no big difference between different sets of features, except some poor combinations. For example, using only the constant gave a pretty bad predictor with an MAE of 280 kSEK.

Size of Training Set
A machine learning application would need thousands, if not millions of data.

For apartments, there are two ways to increase the number of examples:

  • Use a larger geographical area. The problem is that prices depend on the location, which would add complexity to the model. Two similar apartments will have very different prices, depending on their address.
  • Use a longer time interval. This is also tricky - a data set covering a longer period of several years will be affected by price changes in the market.
I'm afraid that I'll have to live with the imperfection in the model.

This concludes the project ApartmentPredictor. For the next blog post, I'll focus on stocks again.

Saturday, 30 November 2019

ApartmentPredictor: A Simple Logistic Regression Price Predictor (1)

Problem:
I want to predict apartment prices for a given area using the size and the monthly cost, using a regression model with statistics for sold apartments in a specified area.

It is fairly simple to get a sample of past apartment deals for an area using some real estate listings.

Preparing the Data
I created a web scraper in python that is using Regular Expressions and the Requests package.

In this data set, the Price reflects the final price agreed between the seller and the buyer.
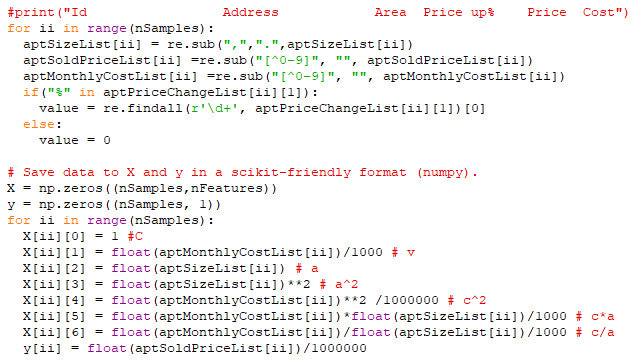
The next step is to prepare the data for the SciKit package in Python. I will use two features (area and cost) to construct a model of seven parameters to optimize for:

I created two numpy arrays for the raw data:

  • X (number of past apartment deals, number of features) 
  • y (number of past apartment deals)


The Panda dataframe is populated by the two arrays:

The result is:
The data set's properties are:
Most of the features are derived from Cost and Area

So, just guessing that the final price would be the mean price would give an average error of 347 kSEK. This will be a measure of the model's performance: I hope that it will generate a lower error than 347 kSEK.

In the next blog post, I'll use SciKit to generate an initial prediction and evaluate that one.

Tools that I use:
SciKit  is a popular package for data analysis, data mining and machine learning. I use the linear regression.
Panda is popular for machine learning too. It makes it easy to organize data
Numpy is useful for matrices, linear algebra and organizing data.

Thanks Nagesh for the inspiring article.


Saturday, 23 November 2019

Machine Learning: Lecture Notes (Week 9)

Gaussian Distribution (Normal Distribution) is used for anomaly detection. I'm quite familiar with this so I won't discuss this in my blog.

The Parameter Distribution Problem
Given a data set, estimate which distribution gave this data set using the Maximum Likelihood method:

  • Estimate that the average (mu) to be the same as the average.
  • Estimate that the variance (sigma) to be the same as the standard error squared.

Anomaly Detection Algorithm
Given a training set of m samples, each with n features, where the samples follow the normal distribution, p(x) can be calculated as:

  • Choose features that might indicate anomalous examples.
  • Fit parameters for the different features such as mean values and variance.
  • Calculate p(x). If p(x) is smaller than a threshold, an anomaly is detected.


Put simply, the likelihood for one example is calculated. If that likelihood is too small, we probably have an anomaly.

This is the last lecture note for this course, since I've completed the course. The next blog post will discuss a simple logistic regression example for apartment prices.

Saturday, 16 November 2019

Machine Learning: Lecture Notes (Week 8)

Unsupervised Learning
Unsupervised learning is training on a training set X without labels y.

Clustering algorithms finds clusters of similar features.

K-means
K-means is the most popular clustering algorithm.

It takes two random points as cluster centroids.
  • Ignore the bias feature.
  • Repeat:
    • For each sample in the training set, it assigns it to the closest centroid.
    • Each centroid is moved to the average location of its assigned training samples.


Optimization Objective
K-means can get stuck in a local optimum. Use random initialization several time to overcome this.

Elbow method for selecting number of clusters.

Create a curve of the cost function versus the number of clusters. The "elbow" will indicate the suitable number of clusters.

It can be necessary to reduce the number of features. Sometimes, features can be seen as redundant.

This can be done by projecting data from a set of higher dimensions to a plane of lower dimensions.

Principal Component Analysis
PCA tries to reduce the error between the data points and its projections.

PCA should not be confused with liner regression

Start with mean normalization (subtracting average from each value). The scale of features must be on a comparable scale.

Calculate coviarance matrix SIGMA = 1/m x^i {x^i}^T
Compute Eigenvectors U, S, V of SIGMA using singular value decomposition (SVD)

This gives U, a matrix of n column vectors. The first k column vectors are the new planes for the PCA.

U_reduce = U(1:k,:)

z=U_reduce^T x

Restoring:
X_approx = U_reduce x


Anomaly Detection - when to use
Use AD when there are few positive examples
Many different and unpredictable types of anomalies.
What features to use?
Use histograms to see whether it is a gaussian feature or not. If it is gaussian, it is suitable for anomaly detection. If it isn't, transform it to a gaussian distribution.

Recommender Systems
One approach can be to use a version of a regression analysis.

Collaborative Filtering
In this case, we don't have any information about the movies, such as romance/action etc. The users has specified which movies they like (theta values).

Alternate optimizing for indata and model parameters to get lower errors.

1. Initialize x and theta to smal random values.
2. Minimize J(x, theta) using gradient descent

Saturday, 9 November 2019

Machine Learning: Lecture Notes (Week 7)

Support Vector Machine (SVM)
The cost function will be modified compared to the sigmod function. It will consist of a constant slope session and a constant session.

In SVM, the parameters CA+B shall be minimized. A is the cost term, B is the regularization term and C controls the weight between them.

When training the hypothesis function, the hypothesis (theta multiplied by input data) shall be

  • Cost1: Bigger than 1, if y = 1
  • Cost0: Smaller than -1, if y = 1

Support Vector Machine
Define f as a similarity function that calculates the proximity to landmarks (combinations of feature values):
The function is based on a Gaussian kernel. Sigma affects the pointyness of the curve - a small sigma means a pointier curve.

Big C (small lambda): Low bias, high variance. Optimizing training set.
Small C (big lambda): High bias, low variance. Optimizing to reduce overfitting.