Showing posts with label Python. Show all posts

Saturday, 15 April 2023

TrafficControl: Bind Python into Program, or Port Scripts to Code?

Currently my program expects the user to have python installed on his/her computer. This will be a severe blocker for any portability and I will need to handle this, either by binding Python into C++ or porting the scripts into C++ code. 

Binding:

Advantages: I would be able to use the existing code

Disadvantages: The binaries may be bigger and that will be a disadvantage when deploying on web assembly

Porting:

Advantages with porting to C++: Everything will be in C++

Disadvantage: Porting the application to C++ may be time consuming.

For now, I'll try porting the code to C++/Qt/Regular expressions.

Legacy Code:

The program creates a shell process that starts python.exe (hard coded for Windows), with a hard coded path to the script. 

In my last commit, I added code to src/networkDesigner.cpp. For the XML/QML handling, I used some code that I found at stack overflow.

This change isn't visible but it is a big step towards Web Assembly.


Saturday, 18 June 2022

Hiding Information in Repos

When adding my codebase to Github, I want to avoid telling the world about my login credentials. To do this, I'll save the information in separate files that will be imported during runtime. I won't push those files to my Github repos and my credentials will remain secret.

I'll focus on Python and Bash in this blog post.

Bash scripts:

Create a file, for example "secrets.cfg" with the content:

password=testa123
In the bash script, source the file. Now, the parameters will be available as $password:
$ source settings.cfg

$ echo $password

testa123

Python scripts:

I'll use dotenv to set environment variables from a .env file that is ignored by Git.

I'll create a file ".env" with the content

DOMAIN=fatsug.example.org

The python script will use dotenv, so you need to install it using pip.

pip install python-dotenv

I'll make the python script look for a .env file in the users home folder. This is how the python script looks like:

import os
from os.path import expanduser
from dotenv import load_dotenv

load_dotenv(expanduser("~")+'\.env')
print(os.getenv('DOMAIN'))
For convenience, I can merge the secrets.cfg and .env files to one. Thus, I'll have all my user credentials at one location. 

Saturday, 20 March 2021

RPI: Upload a File to Cloud in Raspberry Pi CLI

I want to upload a photo to Google Drive or Dropbox using a Python script in a Raspberry PI.

A home surveillance use case might be:
  • A sensor detects that someone has entered the room (not implemented yet!)
  • A camera takes a photo of the living room
  • The picture is uploaded to the cloud before the burglar destroys the Raspberry PI.
Trying Google Drive
I enabled the Google Drive OAUTH using the public documentation and a guide from Iperius Backup. When running the python script, I got a error message that told me that I need to verify the app/script towards Google and that process seemed to be complicated, so I decided to try another approach.

Testing Dropbox

After giving up Google Drive, I found the Dropbox approach to be much more successful. It takes two steps to activate: Create a local script that connects to Dropbox, and define what the script is allowed to do. 

First, I define what the script is allowed to do:
Step 1: Configure the new app access credentials in Dropbox
  1. Log in to Dropbox Developers and go to the App Console and select Create App.
  2. There are three steps to take:
    1. Choose an API - Dropbox allows only scoped access (the creator of the app can select what authorities the app can have).
    2. Choose the Type of Access  You Need - I choose App Folder for security reasons. The Full Dropbox option would allow the app to access all files in my account and that would be risky.
    3. Name your app - this name must be unique in Dropbox. You can't use a name that any other Dropbox developer has used.
Step 2: Now when the app is created, I need to define the scope (privileges) of the app. This is done in Scoped App
Step 3: Select what the app shall be allowed to read and modify in my Dropbox account:
Step 4: Once that is configured, it is time to generate an access token. The default Access token expiration  is Short-lived (expires in four hours). I select No expiration. I click Generate and I copy the code that is shown.
The access token must be re-generated if any access token is changed.
The second part is to write the Python code. 
The script uploads the specified picture with the current time as file name.

That's it! When I run the script, the file is uploaded to my Dropbox account

Of course, I could have set up Dropbox the normal way (assigning a folder and sync it to Dropbox). In this case, I didn't want to save 2G of files on a SD card with limited disk space.

I found a video tutorial that illustrates how to do it:

In my project anatomy, there are only two steps left, before starting the next sprint of my IOT project. 


Saturday, 13 March 2021

IOT: Data from computer to Arduino

One of the tasks on my first IOT  project anatomy is to send data to the Arduino from Raspberry PI to my Arduino board. 

There is one Arduino feature one needs to consider when sending serial data to Arduino over USB port: Every the serial connection is established, the Arduino is reset. This is a feature that simplifies the process of loading software to the board. 

If a script establishes a serial connection to the Arduino, it takes one second for the board to boot. If the script sends serial data during that time, that data is lost. Further, if the connection is released and reestablished, the board reboots.

My solution to that issue is to wait for the board to boot and to keep the connection alive during the entire session.

The data must be encoded to binary format

The sender script specifies interface, baudrate and timeout and the receiving script sends the incoming string to the display for some seconds. 

And finally, the incoming message is shown on the Arduino LCD.

I'm getting close to completion of the first step of my IOT journey. The remaining tasks are to make the Raspberry Pi available from the external internet, send SMS from the router and to push pictures to the cloud from the Raspberry Pi whenever someone activates the emergency button.

After that, I'll plan the next steps for the IOT project.


Saturday, 6 March 2021

IOT: Connecting Raspberry Pi to Thingspeak

This one was easier than I thought. I wanted to send/log data from my Raspberry Pi to Thingspeak. 

Step 1 - Activate a Thingspeak Account and set up a channel

The channel has a number of fields. In this case, I use only one field, "field1".

Step 2 - Get an API key for Thingspeak

The API Write key is necessary for Thingspeak to know what channel to publish to. 


Step 3 - Send data to Thingspeak using "POST" with the channel number and the data.
The free version of Thingspeak allows for one update every 15 seconds. My script simply takes a number from the console and posts it to Thingspeak with a 15 second interval.


The result:

Saturday, 2 January 2021

2020 in Retrospect

2020 was a dramatic year for me and that had some impact on my pet projects. 

The first wave of the pandemic came when I and my family moved to our current home in Åkarp. Luckily, that didn't affect the relocation and the contractors we used for fixing things in the house.

We got our second son when the second wave was escalating in December. 

The pet projects still had some progress:

StockPredictor (C#, Python, SQL and Machine Learning): I created a Python script that connected to the SQL database and analyzed the data, for example identifying stock splits. I also made some improvements to the web scraper. After several months of work with the data, I was able to apply some machine learning algorithms to the data. As expected, the MLPRegressor wasn't able to predict future stock values - it seems that the market is quite efficient.

IOT (Arduino, Raspberry PI): I explored Arduino and followed some simple experiments to learn the basic concepts. After that, I created a simple set of traffic lights with an emergency button and a LCD display. For Raspberry PI, I brought up the system.

In 2021, I'll mainly focus on the house, work and family.  I still think I can have some progress on my pet project in IOT.

Saturday, 24 October 2020

StockPredictor: Using Neural Networks to Try to Predict Stock Values

With the verified training data, I've been trying to predict stock performances, given some key numbers. 

I'm using the scikit toolbox for Python and the initial findings is that the neural network hasn't been able to predict the stock performances. The correlation between the predicted values and the target values is close to zero. 

Findings
I've run several iterations with different parameters, like alpha (learning rate), random state, batch size and whether to use historic data or not. They all point to the same conclusion - there is no easy-to-catch pattern that the neural network can find. 

These finding support the efficient market theory - the past information is already priced into the current stock prices. 

The distribution of the result data is hard to model using a neural network. Most of the data is small, but there are some few outliers that generates large losses for the training function.

The result distribution. 95% of the results are in the range -0.0143 up to 0.0166,
but some outliers are much bigger.


For reference, I trained a neural network for a dataset that is available in sklearn (load_diabetes). That network found a quite strong correlation between predictions and the results (75%). This means that I know how to set up and use data sets for machine learning. 

Summary of the project and the future
I have no plans to continue the project at this moment. The web scraper will keep recording stock records and I'll update the documentation.

Lessons learned:
  • Verify the data early in the project!
  • Use standard schemes for saving the data. Preferably CSV format, and/or a format that can easibly be imported into a database.
  • Add checks for inconsistent data that notifies the operator.
Unplanned future work:
  • Map the results into an machine-learning friendlier distribution. Maybe logarithmic scale?
  • Iterate over different prediction windows. Currently only 7 days is used.
  • Use other algorithms, like K-nearest neighbor.
For the end of the year, I'll explore Internet of Things (IOT) with Arduino and Raspberry PI. The train project will continue in 2021.

Saturday, 10 October 2020

StockPredictor: Exploring the MLPRegressor

I want to predict stock prices using existing data. Optionally, I'll convert the problem into a classification problem ("to buy or not to buy). With the training data in place, I'll explore the Python package scikit-learn.

This article discusses some machine learning algorithms that can be used to predict a numerical value. Neural networks and K-nearest neighbors seems promising. I suspect non-linear relations between features and results, so I don't expect linear regression to work. However, I'll give it a try later.

Multilayer Perceptron Regressor

I based my program on the examples above, with my data from StockReader. 
After training the neural network on ~210 000 examples, I test it on ~50 000 examples. I compare how the neural network is doing with an dart throwing monkey (a simple prediction that the stock performances will be the average daily price increase of the stocks).

The initial output from training the neural network together with verifying it on the test data shows no improvement compared to the monkey. The Median Average Error for the Neural network was 0.095, compared to the benchmark of 0.064. 

The next step will be to investigate other parameters for the neural network, along with other algoritms. Since I will compare different models, I will need to introduce cross validation data. This is important, since I need to make sure to verify the model selection itself.


Useful link:

Saturday, 26 September 2020

StockPredictor: Adding Past Values to Training Data

In my training data for the predictions, I use the following data to predict the changes in stock prices:

Stock Price, P/E, P/C, Yield, Price Margin, RSI and the number of days to dividend. 

I want to be able to add historic key numbers as well and I'll specify that using bit masks,

PriceP/EP/CYieldRSIPMRSI
Days to Dividend
Todayxxxxxxxx
One week agoxxx
Two weeks agoxxx
Three weeks agoxxxx
Code (binary)
11110101100111011011000100010011
Code (Hex)F59DB113

For simplicity, if one parameter is required two weeks ago, the script that generates the training data will add all parameters two weeks ago. The selection of parameters will happen in the prediction script. 

There won't be matching historic dates for all stock records in the database. For the historic dates, I'll try the calculated date +/- one day.
If the current stock record date is on the 27th, I'll search for the one-week-old record on the 20th. If that date can't be found, I'll search for the 19th and 21th. If neither can be found, the program will give up fetching records for that date.

This means that the training set will be some 50% smaller. Removing half of the training set in order to train the neural network on what happened to stocks over the last weeks can, in theory, bias the underlying data. Assumption: I assume that the performance of the recorded stocks are independent on when I recorded the training data.

In the network trainer, the data that isn't used will be removed from the training set. The script will drop the columns that I don't need according to the bitmask.

The next step is to evaluate some machine learning algorithms on the data.

Saturday, 12 September 2020

StockPredictor: Selecting Algorithm and Some Design Considerations

This is the third part of the stock project, where I will use the validated data to train a machine learning system to predict the performance of a stock based on the data that was available at the date of the stock record.

The first step is to make some design considerations for the algorithm. The earliest program will only look at the current stock record for features (X) and the results (y) will be the daily change of the stock.

If I select the prediction window to one week, one example of features and results would be:


The results from a query in the database will look like this:

The X data can consist of values of P, P/E, P/C, Yield, PMI, RSI and the time to/since the last dividend. The y data for the stock record of 2018-10-31 will be the change (%) divided by the days: 
The daily increase of ABB's stock price was 0,054% during one week in November, 2018.
It would have been more mathematically correct to take the seventh
root of the quota, but this time I'll prefer simplicity.

For training data to be useful, there must be a price record in the future that can be used ad y.

I'm saving the data to a huge panda dataframe (the process of populating it from the database (with some necessary processing) takes ~35 minutes. To avoid repeating this cumbersome process every time, I save the dataframe to a csv file, that can be used directly to train the machine learning algorithm. Loading that file takes less than a second.

The Data Set
I suspect that some of the data are highly correlated to each other. For example, Price, P/E and P/C are correlated in the short-term, since earnings and capital per share seldom changes. 

Sometimes, the data contains zeros or null values. 

Regression or Neural Networks

Both regression and neural networks has some pros for this dataset. 

Linear regression

A linear regression would be intuitive for predicting the change in stock price. But there are some zeros in the underlying data that I fear will skew the results. It also seems to be tricky to handle XOR relationships between features. 

Multi-Layer Neural Networks can model complex relationships such as XOR relations and zeroed records. I'll start with this one initially. The

SciKit-Learn

Sklearn has a neural-network-ish regressor that I will investigate.


Saturday, 25 July 2020

StockReader: Handling Broken Scaping

I've seen that the web scraper StockReader script sometimes halts due to various reasons. For example. it can be timeouts from the server.
The connection error is seen occasionally.

I'll handle this by running the script again and again until I get the data I need, while skipping the records that I've already collected.

The first step is to make StockReader check for existing files:

The second step is to acquire the stock names along with the stock ID's for the source web page. Using the names, I can tell whether the particular stock has a record or not. I did that using regular expressions in the script.


The third step is to open the file in read mode (if it exists), and store the contents of that file. After that, I'll close the file.

The fourth step is to open the file in append mode and iterate over all stock names, and fetch the stock data for the missing stock records.

The program works best if I run it some five times. Then it is likely that I'll catch most, if not all stock records for that day.

Issue:
For long stock names, the name is truncated in the web page that lists all stocks:
From the list of active stocks: A3 Allmänna IT- och..
From the in stock info web page: A3 Allmänna IT- och Telekomaktiebolaget
I resolved that issue by adding a second list of truncated stock names. If a stock was found in the truncated stock name list, I iterated over all stock names that already has a stock record. If one of those matched the stock name, the program didn't query that stock information.

Saturday, 11 July 2020

StockAnalyzer: Chasing errors

The work on Stock Analyzer will focus on two tracks in parallel:

  1. Fixing existing data to fit into the database (Scope of this blog post)
  2. Visual the data that is in the database
I see errors when the program is trying to parse values to the database. For example:


2017-06-05 - 2017-08-14: Unable to parse '2017-08-15'. 
2017-08-19 - 2017-11-01: Unable to parse '2017-11-07'
2017-11-06 and later: Unable to parse '2018-02-22'

The issue is that the program tries to parse a date into an integer since the date is on the wrong position in the file.

The first step is to check which stocks it could be that has the faulty data. I can easily do that using grep in my WSL2 environment on my Windows 10  computer.

The faulty data for June contains the string "2017-08-15".
This string is found in the following stocks:
Eniro, Concordia Maritime, Clavister Holding, MindMancer and Tethys Oil 
When importing the different stock records to a spread sheet to see which of the stocks are faulty.

Tethys Oil seems to have some missing data.
I did some maths on the remaining data to check if it is possible to recover the missing bits, but it wasn't. I'll simply remove the records for Tethys Oil for the missing period of time. A new grep instance gives:

This means that the stock records for the company Tethys Oil are corrupted between May 9th, 2017 and November  9th, 2017. Now, I want to remove those lines for the files ranging from 20170509.csv up to 20171109.csv.

For a given file, it is easy to remove lines containing "Tethys Oil":
sed '/Tethys Oil/d' -i file.txt
To identify the files in the desired age span, I tried to find a way to do lexicographic comparisons of the file names in the bash shell. It turned out not to be trivial, so created a Python script instead. 

The output are commands that removes all lines containing Tethys oil from the files in the interval. After pasting them to bash, the erroneous lines has been removed from the files.


Saturday, 13 June 2020

StockAnalyzer: Resuming Transmission

After focusing on global pandemics and relocations for the last months, I am able to resume focusing on my pet projects, but at a slower pace than before. I expect to post at least once per month.

I'll continue coding for the machine learning project StockAnalyzer.

Earlier this year, I explored NodeJS. I'll switch to Python instead, since it is more flexible and since I'm more familiar with it.

StockAnalyzer
I'll document the project in a separate page on the blog. The source code is available on my GitHub page.

StockAnalyzer will both present a number of graphs of how some key numbers are evolving over time.

StockAnalyzer will also perform an automated scan of all key numbers for all records over time in order to detect flawed data, where the data formats are OK, but the numeric values appear to be invalid. This will be done later.

Here, some key numbers are shown over time.
The graphs will help me find outliers and understand the data.
The first step is to present the data graphically - the vast amount of data will make it impossible to just look at the numbers.

Several of the curves appear to have identical shapes. The curves that relates the price to the earnings and capital will be similar to the price curve. This because the earnings and capital per share doesn't change very often. The yield is the dividend divided by the price and that is inversely correlated to the stock price.

In the next blog posts, I'll keep exploring the data.

In the following blog posts, I'll explore the data

Saturday, 7 March 2020

StockAnalyzer: Enabling SQL Server Locally and Accessing it From Python

I've had some challenges when attempting to connect a NodeJS app to a MS SQL database on my computer. To trouble-shoot, I'll start with connecting a python script instead to a database.


  1. First, I need to make sure that the SQL server  is up and running.
  2. After that, I'll test the connection using Python or an UDL file.
  3. If that works, I'll connect using NodeJS
Step 1: SQL Server
From the app Sql Server Configuration Manager, SQL Server is running on my machine.
SQL Server Browser isn't active however. That app provides information about SQL resources and SQL server instances on this computer. It listens to UDP port 1434 and allows several different SQL Server instances on the same port.

If TCP/IP is enabled for  a SQL server, that server is assigned to a port. In addition, it is possible to make the server listen to a specific pipe. 

SQL Server reads out all active instances of the computer and notes their corresponding ports and pipes.

It is possible to reach SQL servers without the SQL Server Browser running on the host, but then the port (and pipe) needs to be specified. It may be necessary to open up a couple of ports in the firewall, such as 1433 and 1434.

First Attempt to Connect to SQL Server Using Python:

The script can't find the SQL server.
Second Attempt to Connect to SQL Server Using Python:

Now, the script can find the SQL server but it can't find the data source.
Now, the script seems to have come a bit further. It doesn't complain about not finding SQL Server anymore. Instead, it says that it can't find the data source. The reason is most likely because I've specified the wrong version of ODBC Driver. 

Third Attempt to Connect to SQL Server Using Python: 
This time I'll specify the actual version of SQL driver: 17.

Yay!

Now, I know that the SQL Server is up and running on my local computer, and I know how to access it from Python. The next step is to connect using a NodeJS script. I'll explore that in the next blog post.

Saturday, 11 January 2020

2019 in Retrospect


This year, I've had some progress on my pet projects. The progress rate was slower in Q4 as we have bought a house. We'll move there in 2020.

Maintaining a house will require some work and learning activities. I expect that the pace of my pet projects will be slower than before.

2019
  • TrafficControl (C++ / Qt) - Paused
    • No work on this project in 2019.
  • StockReader/StockAnalyzer (C# / SQL / MSVC) - Current focus
    • Creating a C# program that scans a folder for result files, extract stock records and parses the data to a database. I've got some experience with Microsoft Visual Studio by now and I'm still learning...
    • Next step will be to fix issues with data conversion to SQL
    • After that, I'll explore some Machine Learning algorithms and check if I can predict stock price changes based on key numbers.
  • ApartmentPredictor (Python) - Done
    • A Python script that made Linear Regression Analysis of past apartment prices in an area. The predictions were based on the apartment size and the monthly cost. 
  • Machine Learning Course at Stanford (Octave / Matlab)  - Done
    • I successfully attended and finished the course in Machine Learning from Stanford University.
    • I applied some machine learning for a pet project for a friend. The simulations indicated that the result was random to a very high degree,
  • TravelTimeCalculator (Java / SQLite / Android Studio) - Done
    • I've completed the project now. TravelTimeCalculator allows the user to compare travel time/cost between several positions on a map. They can also customize the travel cost to consider both travel time, economic costs and environmental cost.


  • Work (C / Python / 4G / 5G) At work, I've focused on test and some coding for 5G with focus on antenna calibration.
To Do in 2020:
Prio 1: The New House!
Prio 2: StockReader/StockAnalyzer

Saturday, 21 December 2019

ApartmentPredictor: Evaluation an Linear Regression

The script is now "code complete" - I think that the code works, but I haven't verified it yet.

The bitmap below reflects whether or not the model contains some features (whether some theta values always should be zero or not):
One test run of the model looks like this:
First, some characteristics of the y data set (final prices)
The bitmap reflects which of the features should be included in the model.
The MSE and MAE are shown for different sizes of training set/test set.
The best feature sets are recorded, both for MAE and MSE
The standard deviation of the price is 360 kSEK. When training different sets of features for different training sizes, the Medium Absolute Error is between 210 kSEK and 280 kSEK.

For example, when using a bitmap of 1010101 (considering constant, cost, area^2 and cost/area) and training it for 40 samples and testing on 10 samples, the average MAE is 217 kSEK. In this case, I repeated each bitmap/training set size for 100 times. This means, that I can make better predictions on the final prices using this program, compared with just guessing.

For one specific apartment that is for sale, the model predicts 2.1 MSEK +/- 0.2 MSEK. Time will tell what the actual price will be.

How to Evaluate the Performance of Linear Regression 
Initially, the linear regression algorithm operates on some training data. It estimates the error by adjusting the parameters using the gradient. It is repeating that, over and over and over again. 

When this is done, one should use the model to make predictions, and to compare those predictions to the actual data.  

Error Metrics - There are several ways to estimate errors of predictions. There are plenty of articles that are discussing which to use and when. I'll compare both the Mean Squared Error and the Mean Absolute Error. 

The advantage of MSE is that it will punish big errors but on the other hand, it is not so robust to outliers.

Number of Features
The simulations suggest that there is no big difference between different sets of features, except some poor combinations. For example, using only the constant gave a pretty bad predictor with an MAE of 280 kSEK.

Size of Training Set
A machine learning application would need thousands, if not millions of data.

For apartments, there are two ways to increase the number of examples:

  • Use a larger geographical area. The problem is that prices depend on the location, which would add complexity to the model. Two similar apartments will have very different prices, depending on their address.
  • Use a longer time interval. This is also tricky - a data set covering a longer period of several years will be affected by price changes in the market.
I'm afraid that I'll have to live with the imperfection in the model.

This concludes the project ApartmentPredictor. For the next blog post, I'll focus on stocks again.

Saturday, 27 April 2019

StockAnalyzer: Applying Machine Learning on Stock Information

After using some neural networks to analyse a small set of data for a friends pet project, I will focus on my own data.

I have a web scraper, StockReader, that collects some information about public stocks that are listed in Sweden. That has been in use for eight years and I have more than 1500 snapshots of a couple of hundreds of stocks.

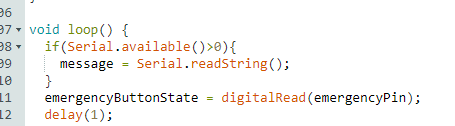
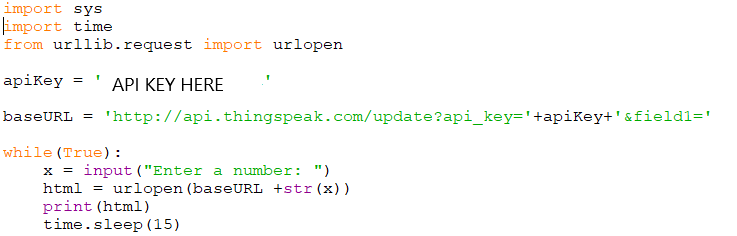
It was originally written in C++ (the code was terrible, but it was essential for me to learn to build a more complex program) and I later ported that to a twenty-four line python script that is scheduled to run three times a week.

Now, I want to use the data to learn more about machine learning and analysis of time series. I also want to get experience from C#/Visual Studio and Angular JS.

I don't expect to find a magic algorithm  that helps me in stock-picking. The purpose of this project is to learn coding, machine learning, C#, Visual Studio and Angular JS.

The Different Technology Areas for the Project
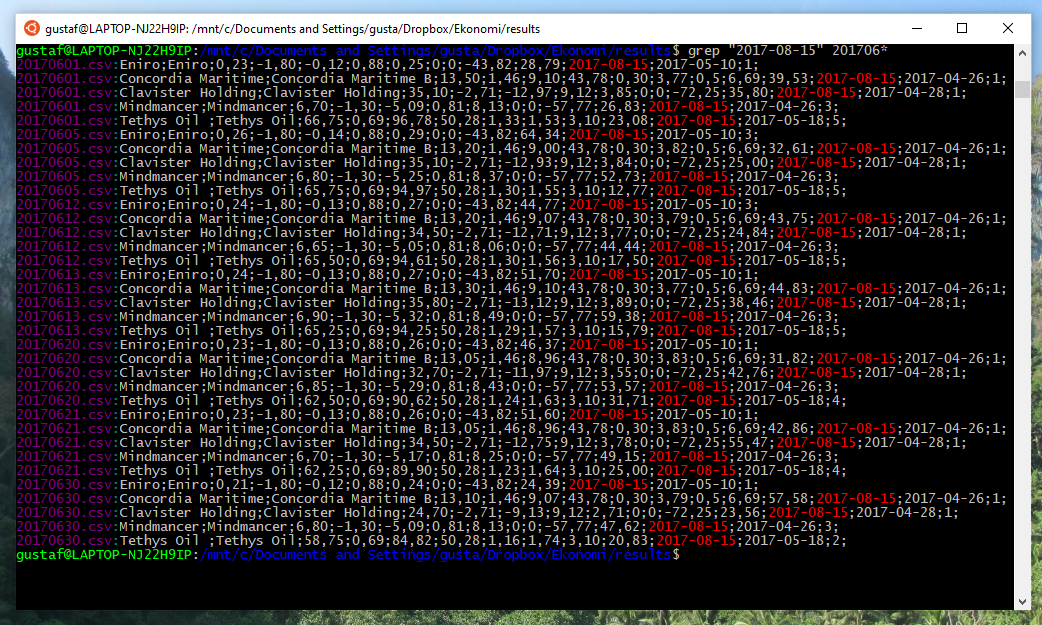
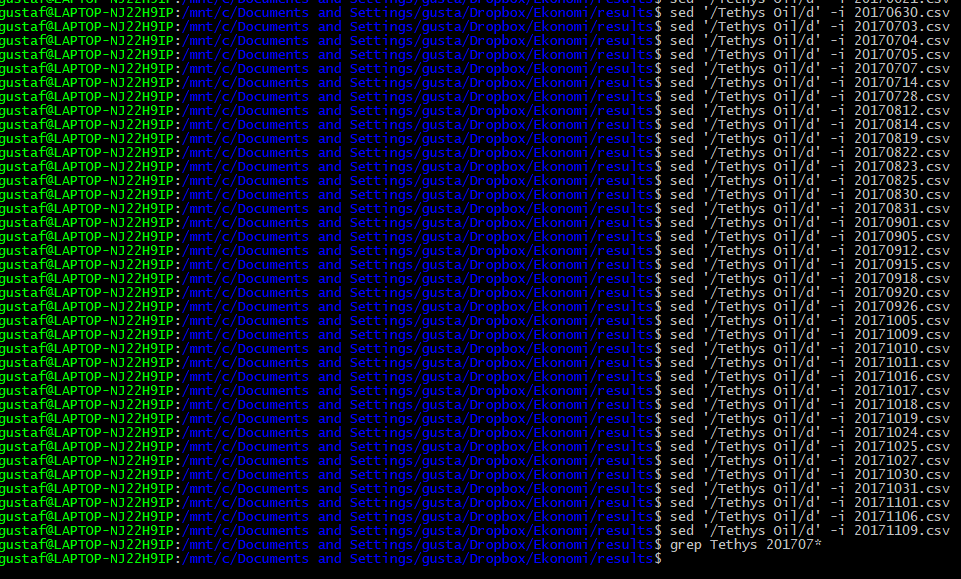
The data is saved in csv files (comma separated values). The data includes stock price, earnings per share, dividends, profit margin, RSI and date for the quarterly reports.

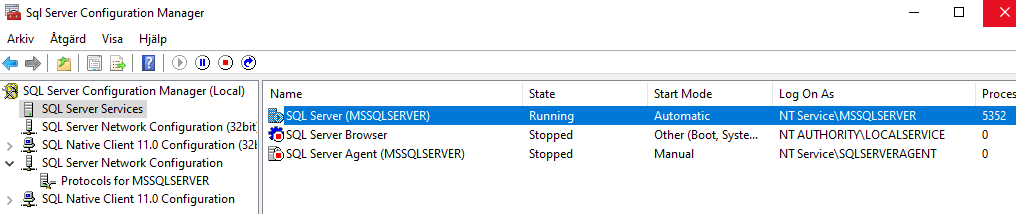
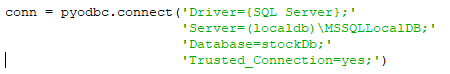
I will create a Windows program based on C# in Visual Studio to populate a mySQL database with the stock data. It would probably be easier using Python but I want to explore new tools and programming languages.

After the data is in the database, I will build a web app using Angular JS, That program will check the data and search for possible stock splits and inconsistent data.

Once the data is corrected, I will analyse it. Since Python has very powerful AI packages, I will use Python to extend the web app above.

I will start by describing the data and some relevant topics for stock markets.

Saturday, 20 April 2019

Machine Learning: Using a Neural Network for Value Prediction

Until now, I've been using a Neural Network for a binary classification. Predicting a continuous value would be more relevant for my case.

I found an example that is using the sckit-learn package.

The Peer Project
This time, I've made some changes to the input data:

  • I will make the neural network train for the actual training output data instead of a binary representation of that data.
  • I will sort the training input data in three groups of thirteen values:
The values are initially arranged in triplets (likelihoods for events 1, X and 2) for thirteen samples. 
I sorted the array by descending values with a simple modification of the numpy sort command:

I use the MLPRegressor with some different random seeds and 10000 iterations.

The results are a bit disappointing. For some random seeds (and different sets of training/test data), the errors are smaller after 10000 iterations, compared to after one iteration.
Seed 300, 10000 iterations. 

Seed 400, 1 iteration

Seed 400, 10000 iterations

Seed 400, 1 iteration

The error messages are reoccurring and indicates that the convergence is too weak. It seems not to be any easy-detectable link between inputs and the magnitude of the output.  

Adding more iterations seems not to be the magical solution either.
For 20 000 iterations, the error is smaller than for 10 000 iterations.
But for 40 000 iterations, the error is increasing.
It seems that it is very important to be able to interpret the neural networks!

Checking a Known Data Set
As a sanity check, I've been training the MLPRegressor on a small training set:
This sample should be quite easy for an neural network to train.
I tested with a test size of 0.2 (6 or 7 samples in training set and 1 or 2 samples in test set):

One iteration:
The MLPRegressor wasn't able to converge after one sample.
This makes sense, since it takes quite a number of iterations to converge.
Ten iterations:
I still see the warning about convergence, but the errors are smaller.
This means that the algorithm is converging after all
A Thousand Iterations:
The error isn't shown anymore, and the errors are smaller now.
A Million Iterations:
Here, I'm running twice on the same setup.
The first optimization converged much more poorly than the second one.
The reason for this is probably an unfortunate selection of training data.  
Another optimization with a poor distribution of test and training data.
The training data contained all the "zeros", but the test data contained none.
This made a difference between the training and test data. 
The example above illustrates how important it is to have a big set of data to test and train on. 


I'll finish this part of my Neural Network project for now. The next project will start in the next blog post and cover much more training data.