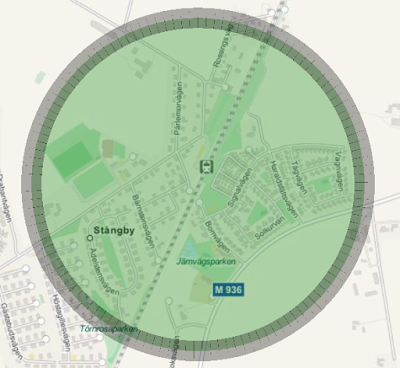
Some of the information I want to visualise for the stations are:
- Number of waiting passengers
- Number of people in the surrounding area
- A metric for the delay
- Status of occupied platforms on station: All platforms available/Some of the platforms are available/No Platforms available
- border.color
- border.width
- center - given by the station's coordinates
- color
- radius
- opacity - it should be possible to see through the item.
 |
| In this example, the border color is black and the width is is 30 pixels. |
The MapCircle can also be hidden by setting the property visible=false.
For future studies:
- If neccessary, one can also add internal QML items inside the mapItem.
- Maybe I can have some more detailed information to show on the station, either by
- clicking/toggling the QML item, or
- presenting information related to the QML item that is currently highlited.
No comments:
Post a Comment